Fig. 6
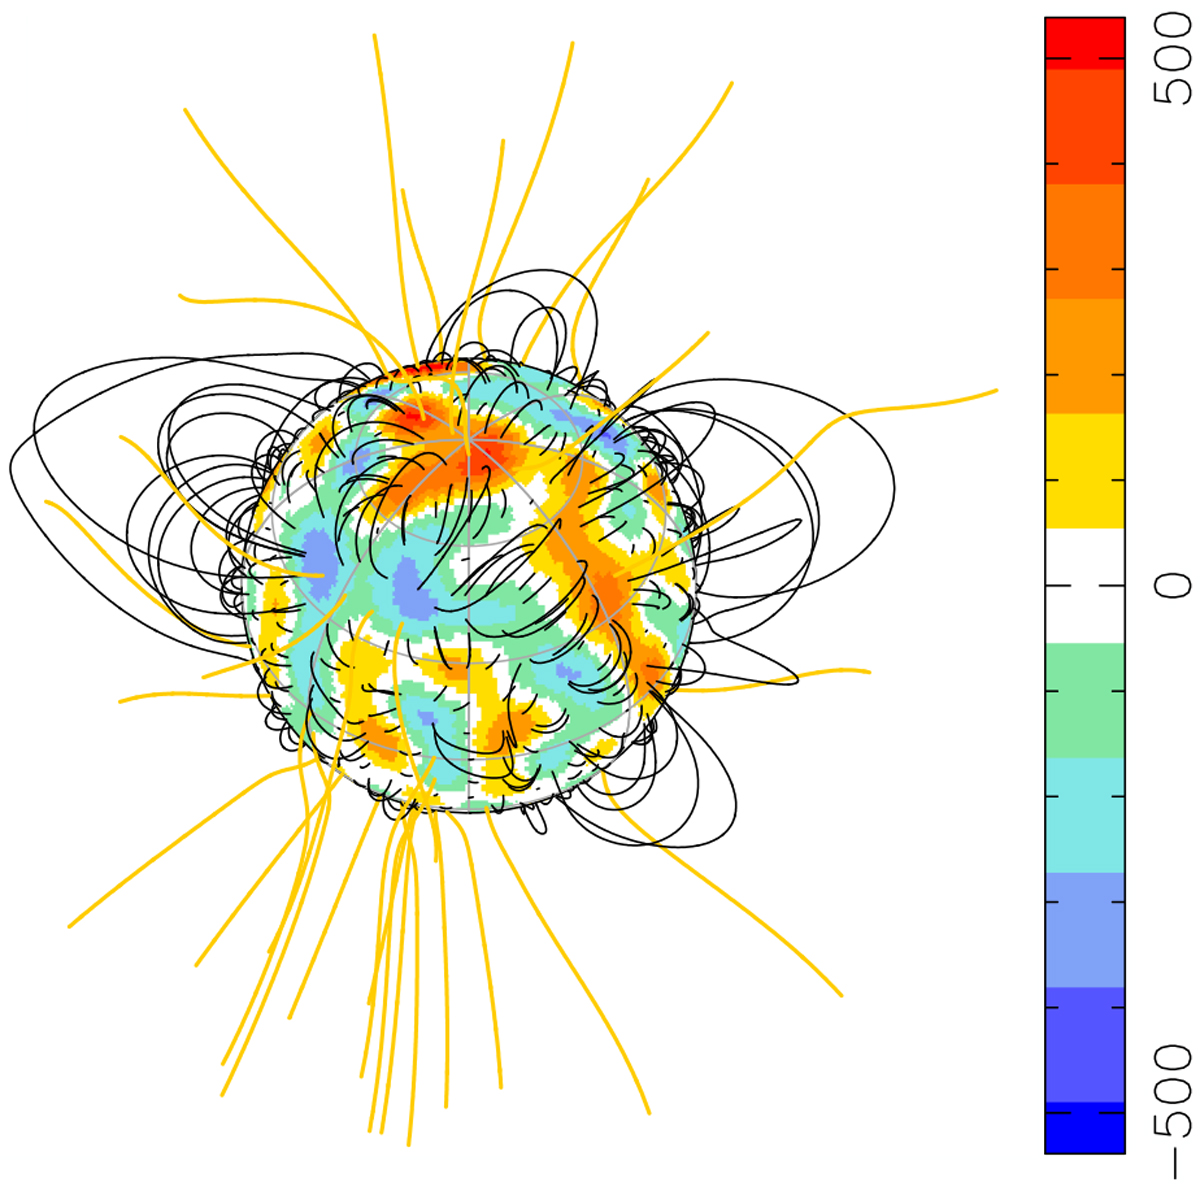
Large-scale potential field extrapolation of V530 Per. The star is seen at phase 0.0, with a 40° inclination angle. The blue and white lines represent open and close field, respectively. The color scale on the surface show the strength of the radial field component (in Gauss), following Fig. 5. The source surface is located at 2.5 R*, which is a bit further away from the star than the corotation radius (at 1.9 R*).
Current usage metrics show cumulative count of Article Views (full-text article views including HTML views, PDF and ePub downloads, according to the available data) and Abstracts Views on Vision4Press platform.
Data correspond to usage on the plateform after 2015. The current usage metrics is available 48-96 hours after online publication and is updated daily on week days.
Initial download of the metrics may take a while.