Fig. 5
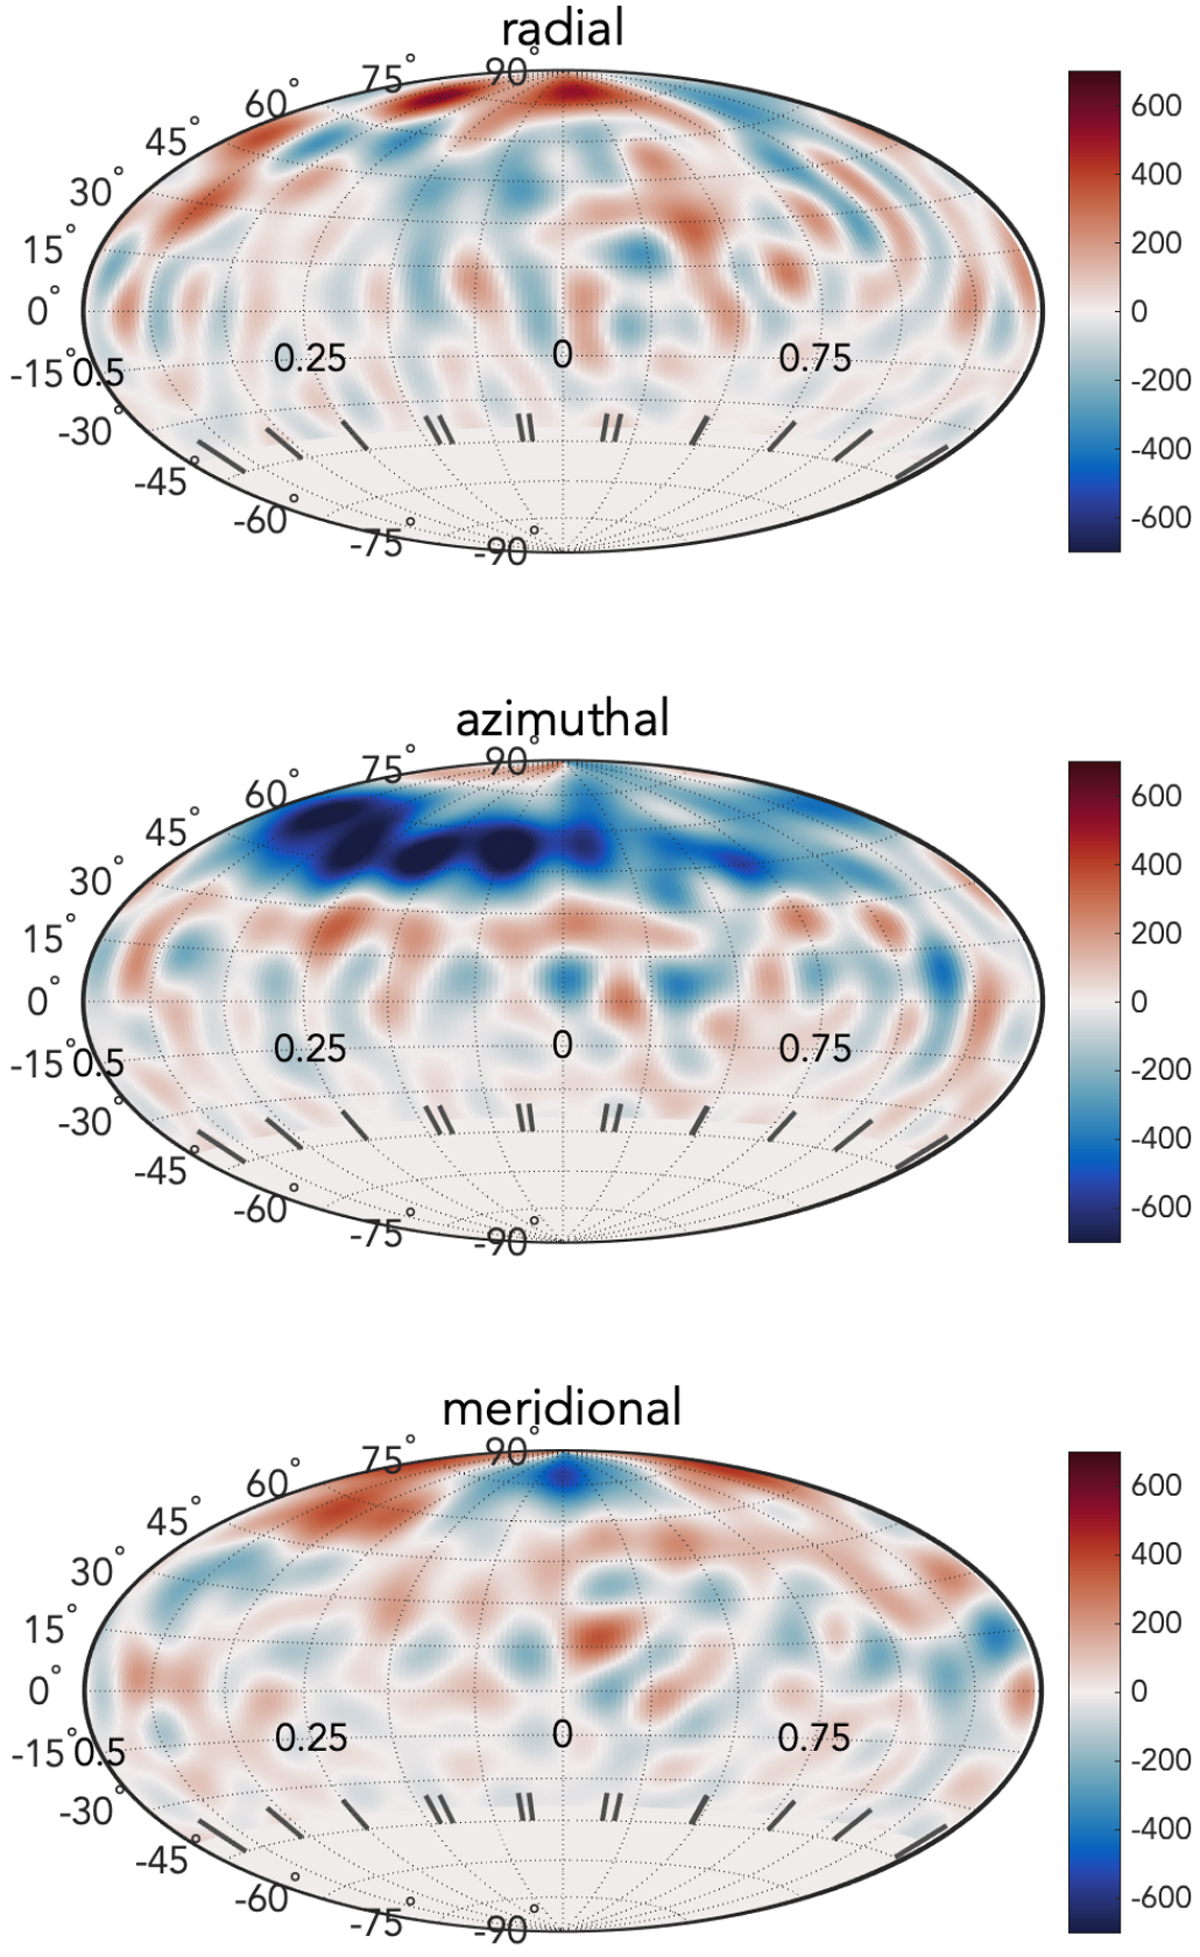
Magnetic map of V530 Per. The three panels show the different field components in spherical projection. The color scale illustrates the field strength in Gauss. A Hammer projection of the stellar surface is adopted, and vertical ticks in the bottom of the panels show the rotational phases of individual Stokes V sequences.The portion of the maps below − 40° of latitude is set to 0, as it is invisible to the observer.
Current usage metrics show cumulative count of Article Views (full-text article views including HTML views, PDF and ePub downloads, according to the available data) and Abstracts Views on Vision4Press platform.
Data correspond to usage on the plateform after 2015. The current usage metrics is available 48-96 hours after online publication and is updated daily on week days.
Initial download of the metrics may take a while.