Fig. 4
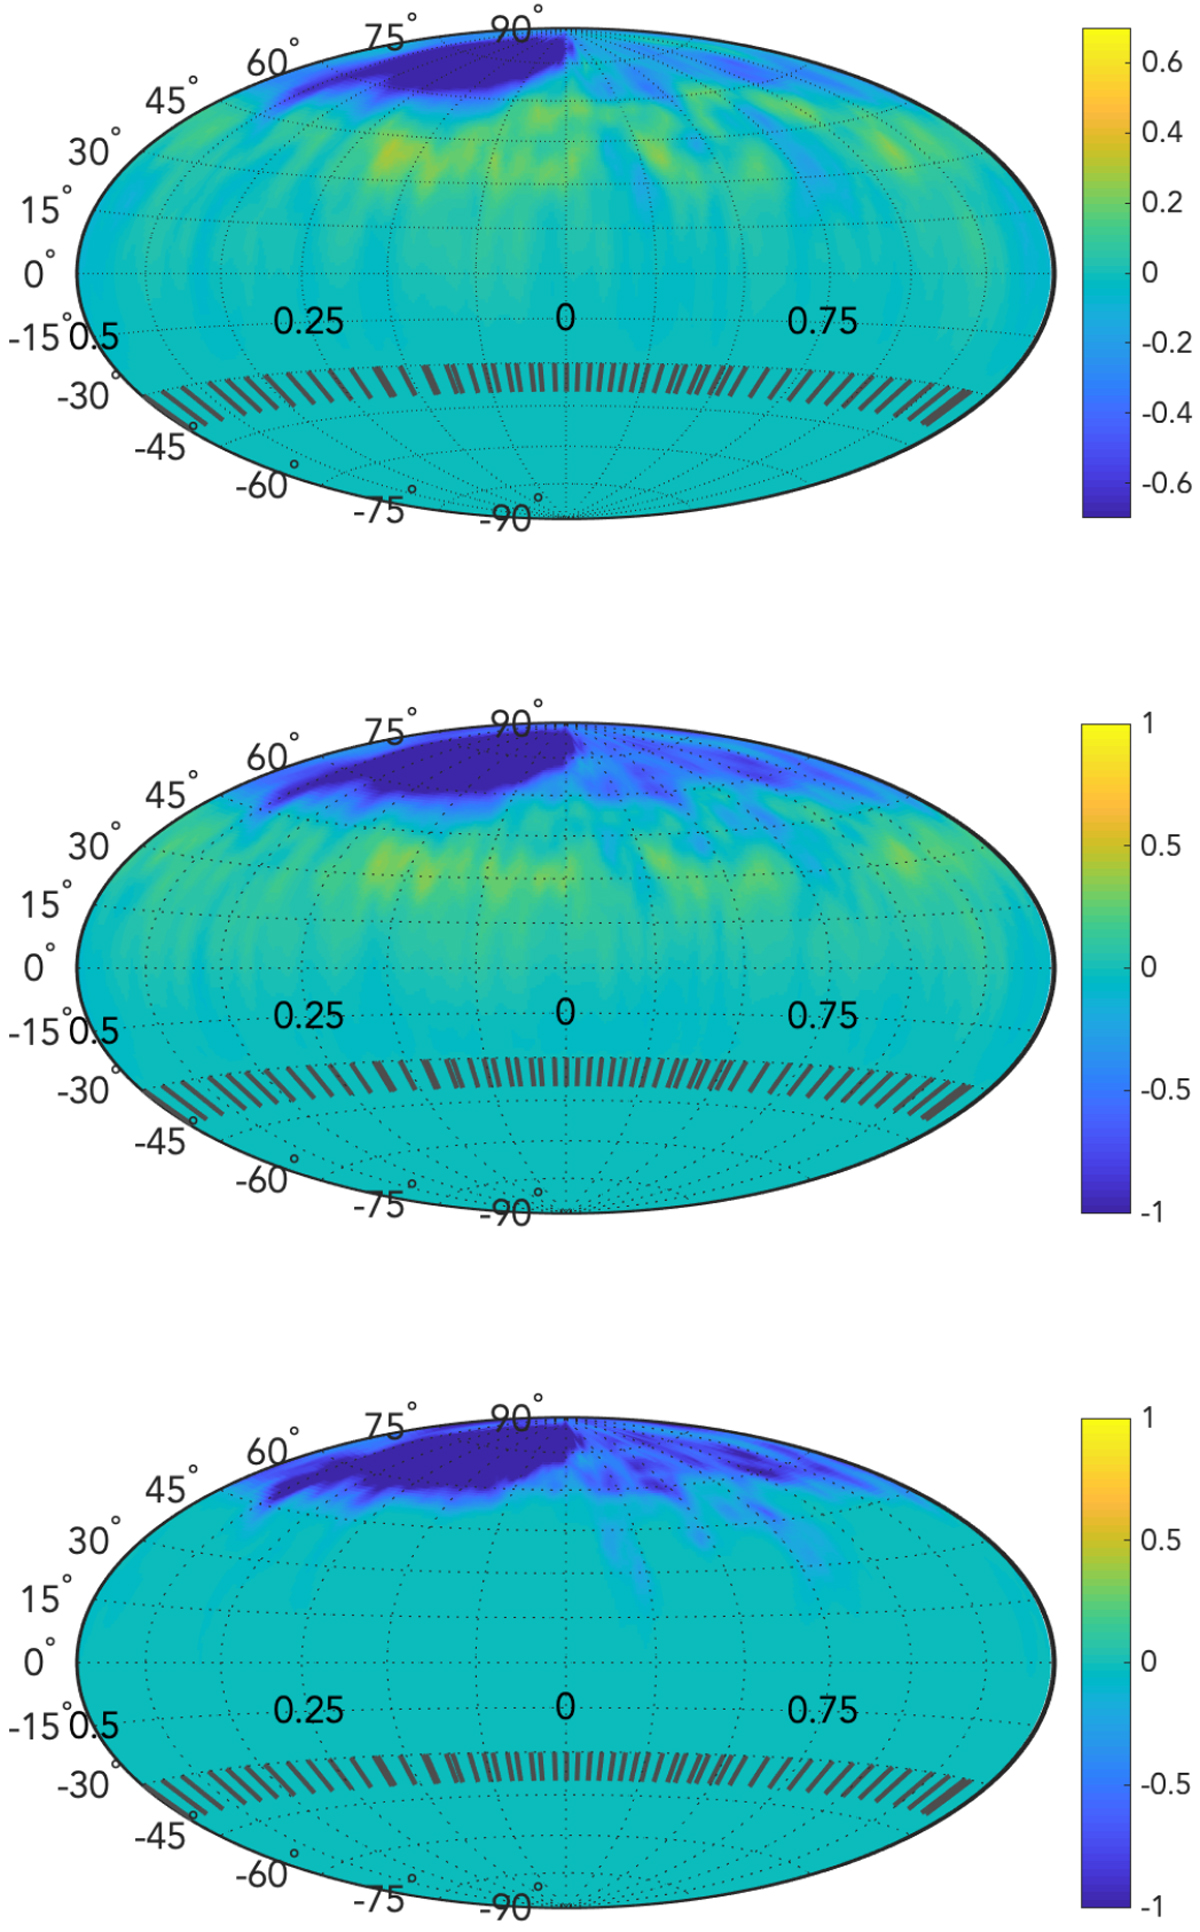
Logarithmic normalized brightness maps of V530 Per reconstructed assuming a combination of dark and brights spots and an spherical surface (upper panel), dark and bright spots and an oblate surface (middle), or dark spots only and an oblate model (lower panel). For display clarity, the gravity darkening was subtracted from the brightess distribution of oblate models. The dark spot model provides us with a reduced χ2 = 0.65, while introducing bright spots reduces this value to 0.55. We used here a Hammer projection of the stellar surface. Meridional ticks in the bottom of the maps mark the rotational phases of our observations. The portion of the maps below − 40° of latitude is set to 0, as it is invisible to the observer. We emphasize that the color scale is different for spherical and oblate models.
Current usage metrics show cumulative count of Article Views (full-text article views including HTML views, PDF and ePub downloads, according to the available data) and Abstracts Views on Vision4Press platform.
Data correspond to usage on the plateform after 2015. The current usage metrics is available 48-96 hours after online publication and is updated daily on week days.
Initial download of the metrics may take a while.