Fig. 3
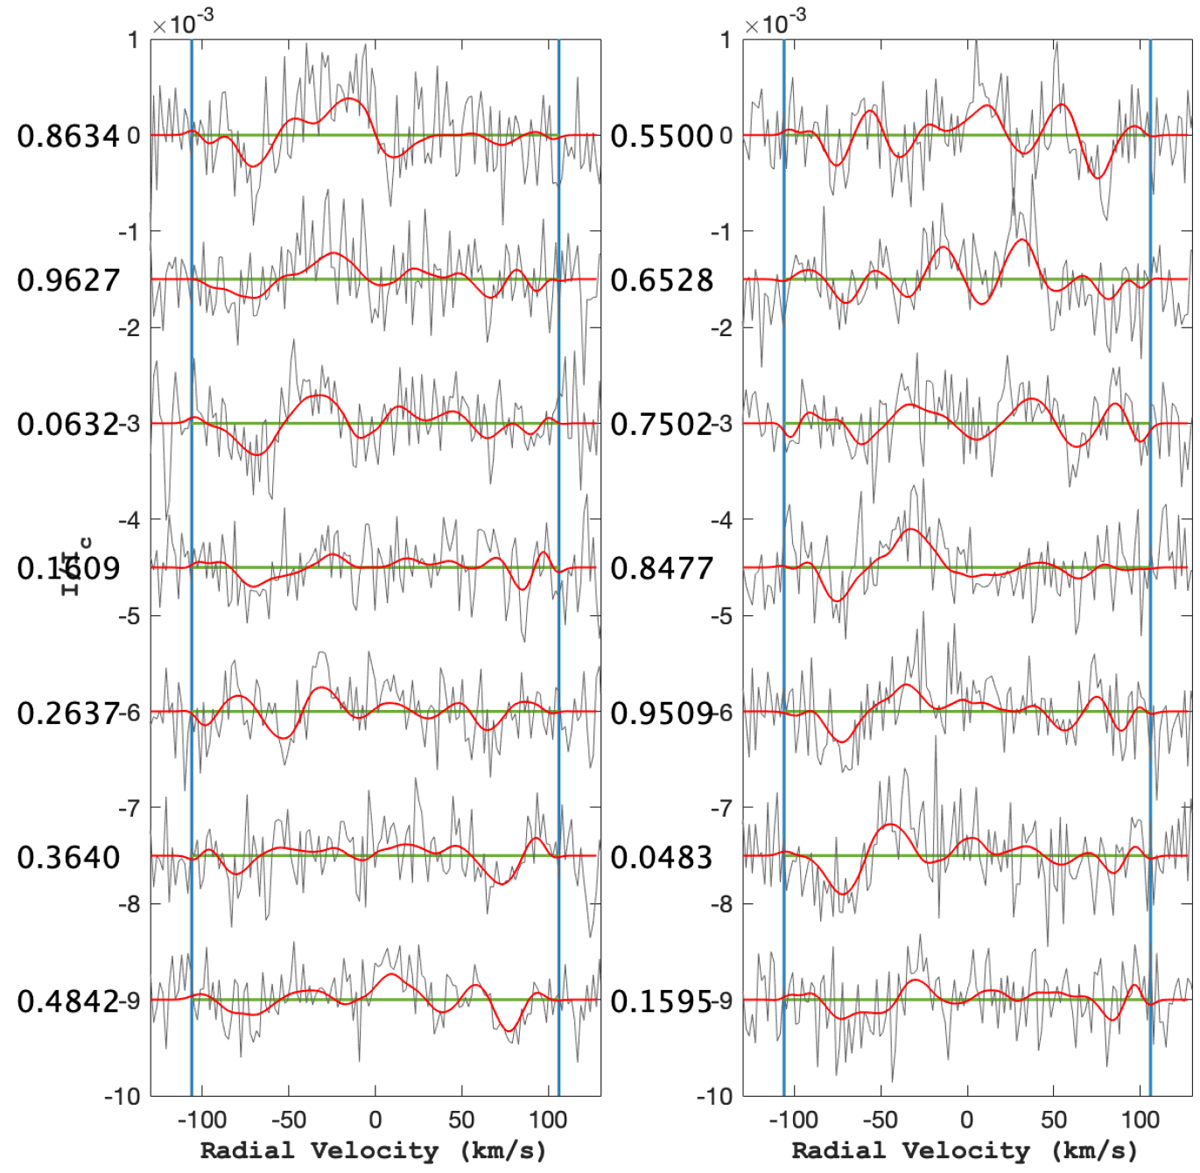
Stokes I dynamic spectrum of V530 Per, after subtraction of the averaged Stokes I profile. From left to right: observations, DI model with χ2 = 0.55 including both bright dark spots, model residuals. The two additional panels on the right show our model with χ2 = 0.65 and dark spots only, and the model residual. The vertical, black, dashed lines mark the ± v sin i limit. The portion above the solid, horizontal red lines represents data from 05 Dec. 2006, while the lower part represents data taken on 29 Nov. 2006.
Current usage metrics show cumulative count of Article Views (full-text article views including HTML views, PDF and ePub downloads, according to the available data) and Abstracts Views on Vision4Press platform.
Data correspond to usage on the plateform after 2015. The current usage metrics is available 48-96 hours after online publication and is updated daily on week days.
Initial download of the metrics may take a while.