Open Access
Fig. 2
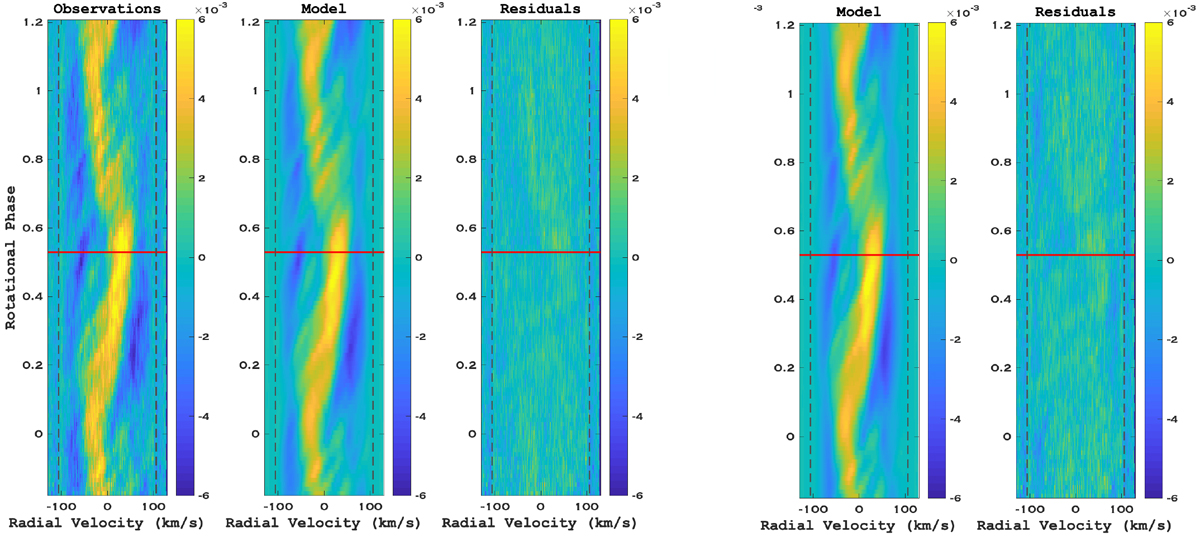
Stokes V LSD profiles of V530 Per. Gray lines represent the observations, while red lines show our ZDI model. Blue vertical linesmark the ±v sin i limit. Left panel: data from 29 Nov., and right panel: 05 Dec. Rotational phases are indicated on the left of each panel.
Current usage metrics show cumulative count of Article Views (full-text article views including HTML views, PDF and ePub downloads, according to the available data) and Abstracts Views on Vision4Press platform.
Data correspond to usage on the plateform after 2015. The current usage metrics is available 48-96 hours after online publication and is updated daily on week days.
Initial download of the metrics may take a while.