Fig. 5.
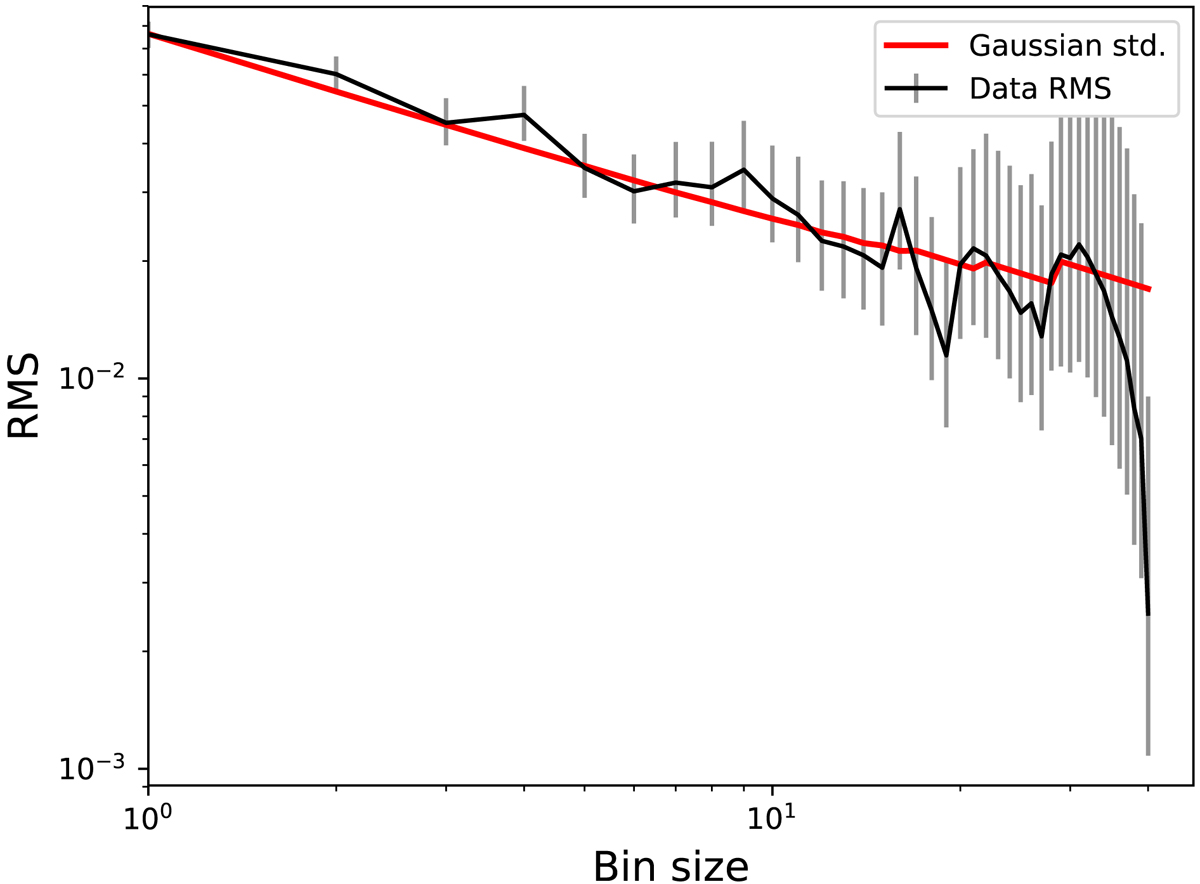
Binned rms residuals vs. bin size plot of the photometry of SN 2018gv on the second night. The rms of the binned residuals, rmsN, is shown as a black curve as a function of bin sizes. The grey error bars represent the uncertainty of rmsN. The red curve shows the expected rms σN and the saw-tooth shape of the black curve arises from the change in M.
Current usage metrics show cumulative count of Article Views (full-text article views including HTML views, PDF and ePub downloads, according to the available data) and Abstracts Views on Vision4Press platform.
Data correspond to usage on the plateform after 2015. The current usage metrics is available 48-96 hours after online publication and is updated daily on week days.
Initial download of the metrics may take a while.