Fig. 4.
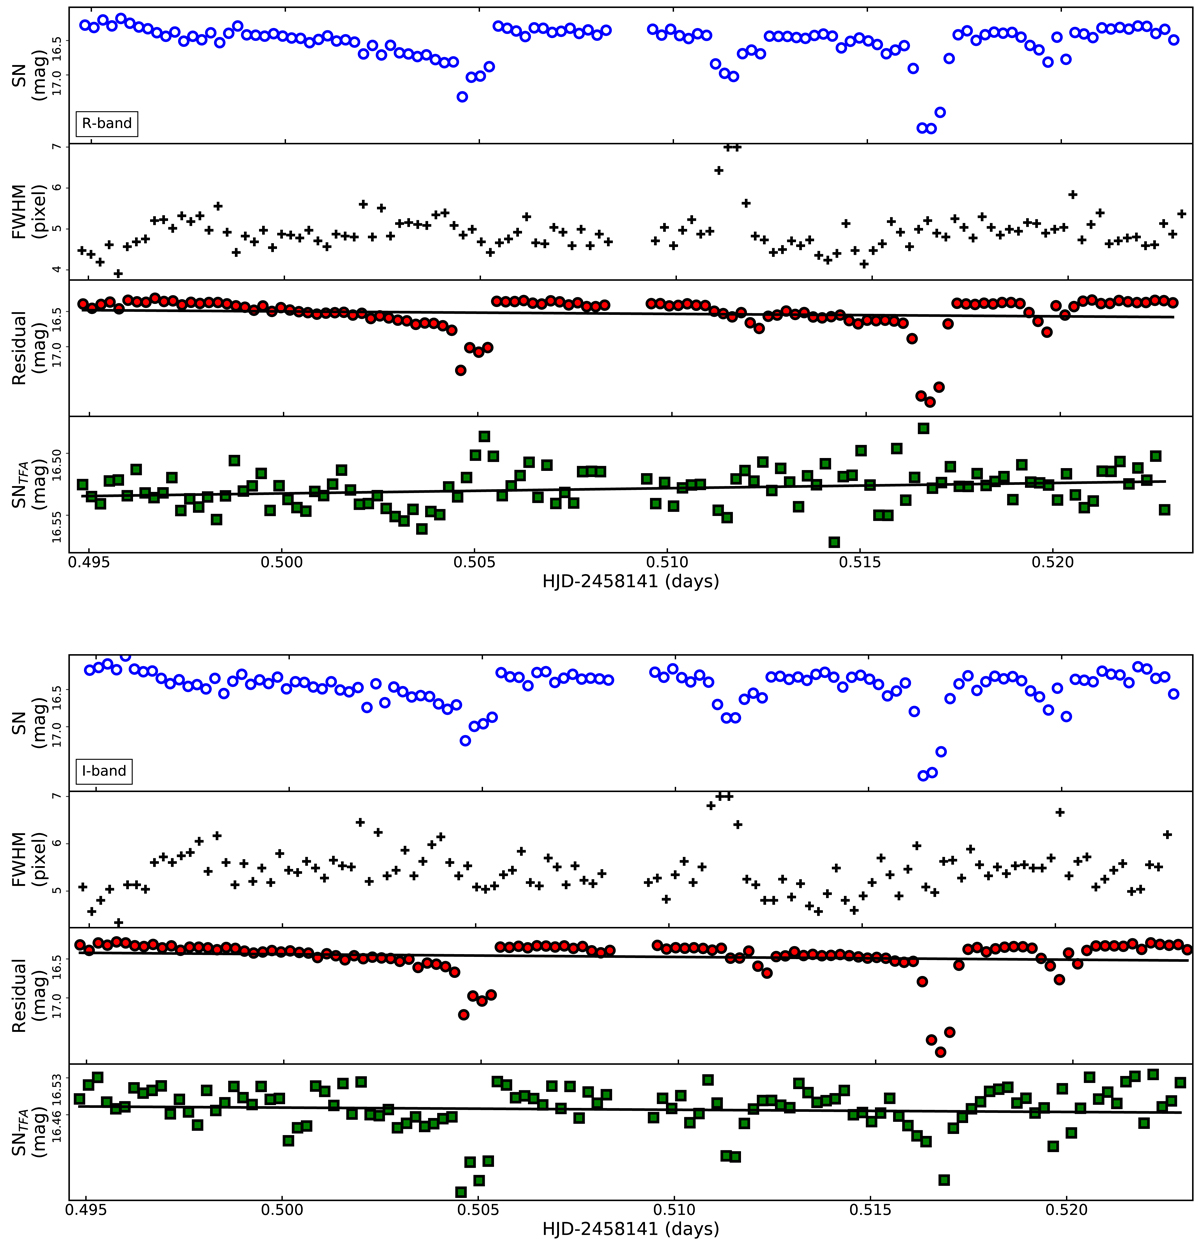
Light curves of SN 2018gv in the R (upper plot) and I bands (lower plot), respectively, obtained with the Kryoneri telescope during the third run. Top panels: instrumental photometric light curve from VAPHOT. Second panels: seeing as a function of time. Third panels: residual supernova light curve after the subtraction of the FWHM features. The reconstructed light curve after the implementation of TFA for the systematic effects appears on the last panel.
Current usage metrics show cumulative count of Article Views (full-text article views including HTML views, PDF and ePub downloads, according to the available data) and Abstracts Views on Vision4Press platform.
Data correspond to usage on the plateform after 2015. The current usage metrics is available 48-96 hours after online publication and is updated daily on week days.
Initial download of the metrics may take a while.