Fig. 9.
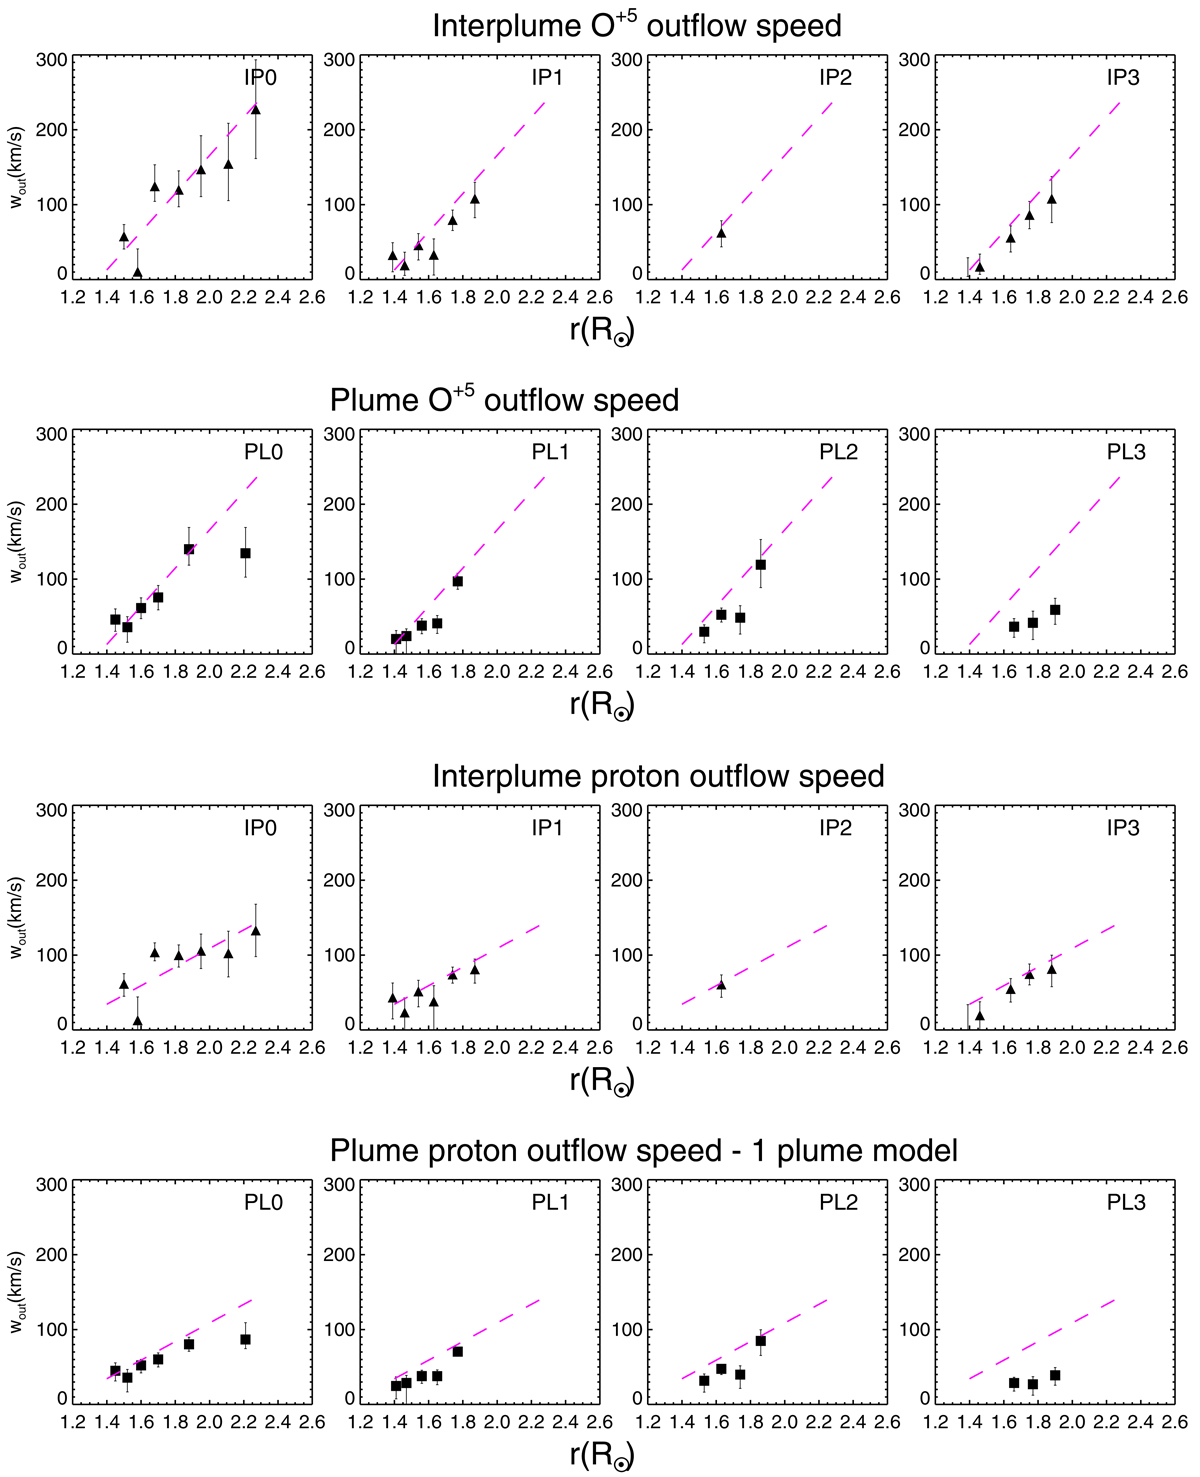
Outflow speed of O+5 in interplumes (first row from the top) and plumes (second row), in the case of a one plume model. The analogous results for protons are shown in the third and fourth rows. The red lines represent, for comparison, the interplume O+5 and protons outflow speed profiles (see Eqs. (9) and (10), respectively).
Current usage metrics show cumulative count of Article Views (full-text article views including HTML views, PDF and ePub downloads, according to the available data) and Abstracts Views on Vision4Press platform.
Data correspond to usage on the plateform after 2015. The current usage metrics is available 48-96 hours after online publication and is updated daily on week days.
Initial download of the metrics may take a while.