Fig. 3.
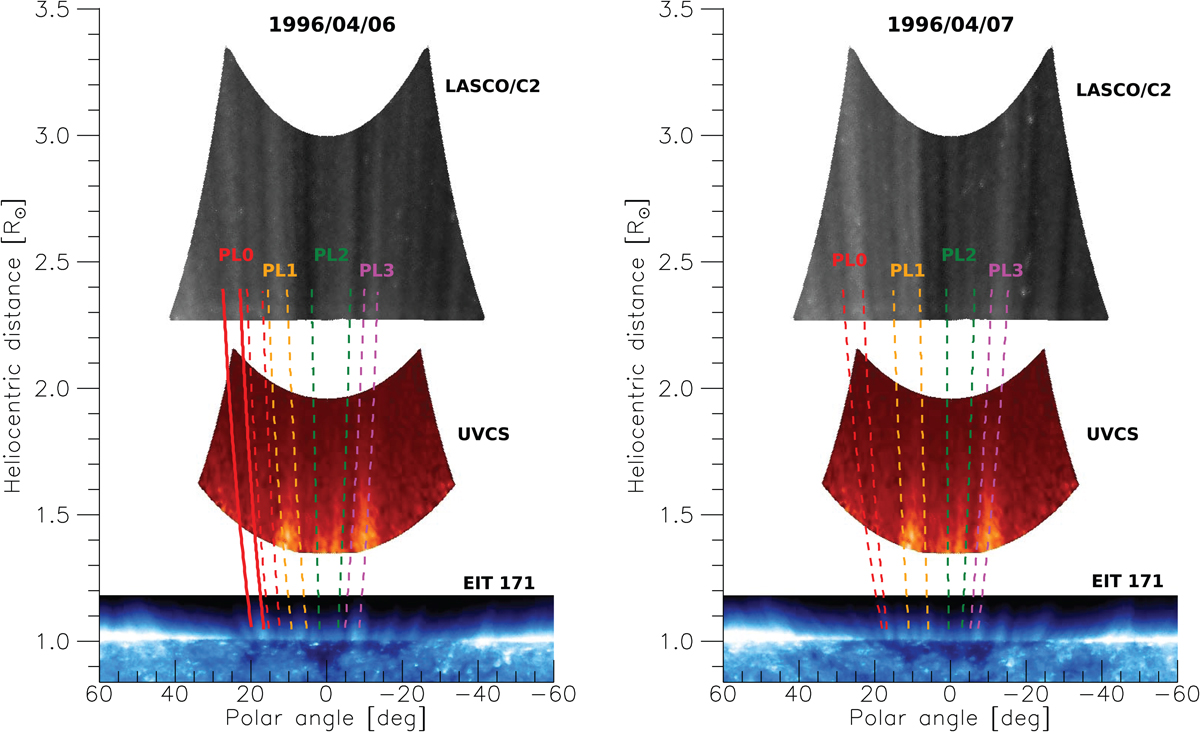
Composite UVCS, LASCO/C2, and EIT 195 Å images of the solar corona, taken on 6 and 7 April, left and right panel, respectively. The plume identification has been made easier by stretching the contrast in the UVCS, LASCO, and EIT images, and by mapping them in polar coordinates, as the spatial scales of the three instruments are different. We point out that the UVCS image in the O VI 1031.9 Å line has been obtained by juxtaposing the intensity profiles along the slit, as the covered coronal fields of the observations turned out to be at contiguous altitudes, and not by interpolation. The fits of the magnetic field lines of the Banaszkiewicz et al. (1998) model to the plumes we identified in LASCO, UVCS and EIT images (see Table 2) are shown as dashed lines. In the left panel, plume PL0 appears to split into two components in the LASCO and EIT images, and the fitted line profiles of the east side component has been shown in the panel as a dotted line. In UVCS data the PL0 east side component has not been considered owing to the low signal.
Current usage metrics show cumulative count of Article Views (full-text article views including HTML views, PDF and ePub downloads, according to the available data) and Abstracts Views on Vision4Press platform.
Data correspond to usage on the plateform after 2015. The current usage metrics is available 48-96 hours after online publication and is updated daily on week days.
Initial download of the metrics may take a while.