Fig. 2.
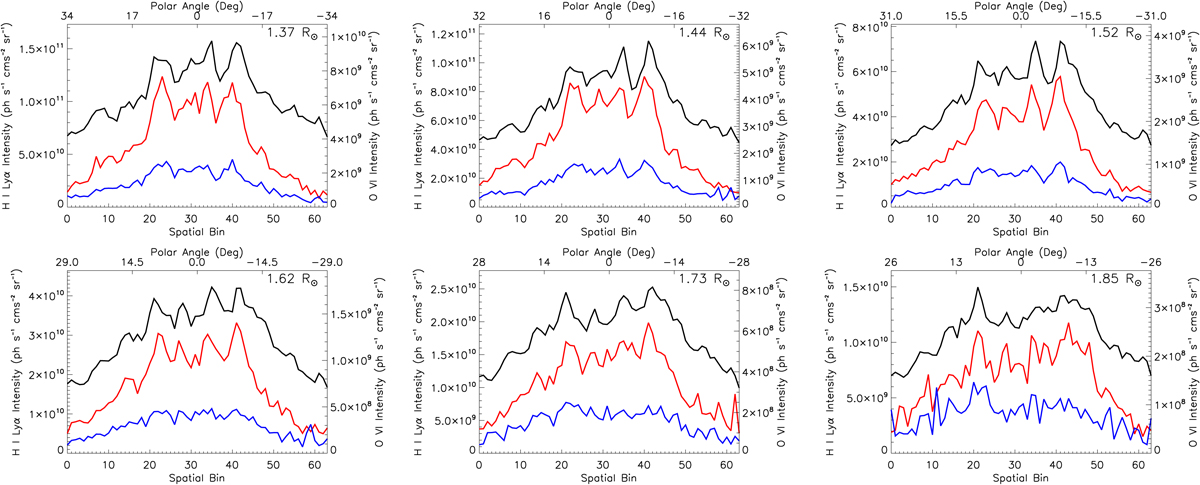
Intensity profiles in the north polar coronal hole, along the UVCS slit for six heliocentric distances. Intensity profiles of the redundant H I Lyα are shown as black solid lines. The O VI 1031.9 and 1037.6 doublet intensities are represented by red and blue solid lines, respectively. We limited the sample of our data to the observations performed on the 6 and 7 April, with the slit center covering heliocentric distances up to 1.85 R⊙. The abscissa axis reports the polar angle latitude in degrees (upper axis) measured counterclockwise from the north pole, and the corresponding detector bins (bottom axis).
Current usage metrics show cumulative count of Article Views (full-text article views including HTML views, PDF and ePub downloads, according to the available data) and Abstracts Views on Vision4Press platform.
Data correspond to usage on the plateform after 2015. The current usage metrics is available 48-96 hours after online publication and is updated daily on week days.
Initial download of the metrics may take a while.