Fig. 1.
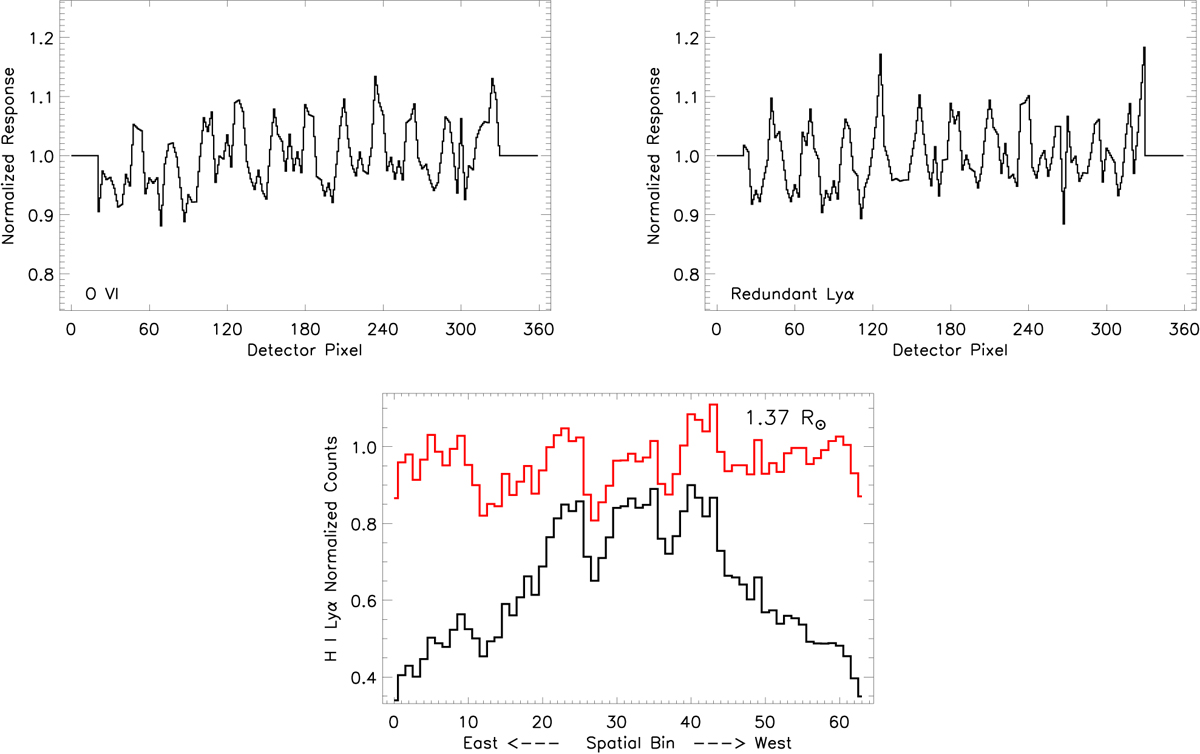
Flat field response of the O VI channel along the UVCS slit in the O VI doublet (top-left panel) and redundant H I Lyα (top-right panel) spectral intervals. An example of bias-corrected data is shown in the bottom panel, where the original data are represented by a black curve and the corrected data are shown with a red curve. The data corrected for the detector flat field response have also been normalized to the value measured at the pole, only in this figure for graphical reasons, in order to account for the coronal intensity decrease, when moving from the slit center to parts of the corona at higher distances (see text for correction description).
Current usage metrics show cumulative count of Article Views (full-text article views including HTML views, PDF and ePub downloads, according to the available data) and Abstracts Views on Vision4Press platform.
Data correspond to usage on the plateform after 2015. The current usage metrics is available 48-96 hours after online publication and is updated daily on week days.
Initial download of the metrics may take a while.