Fig. 6
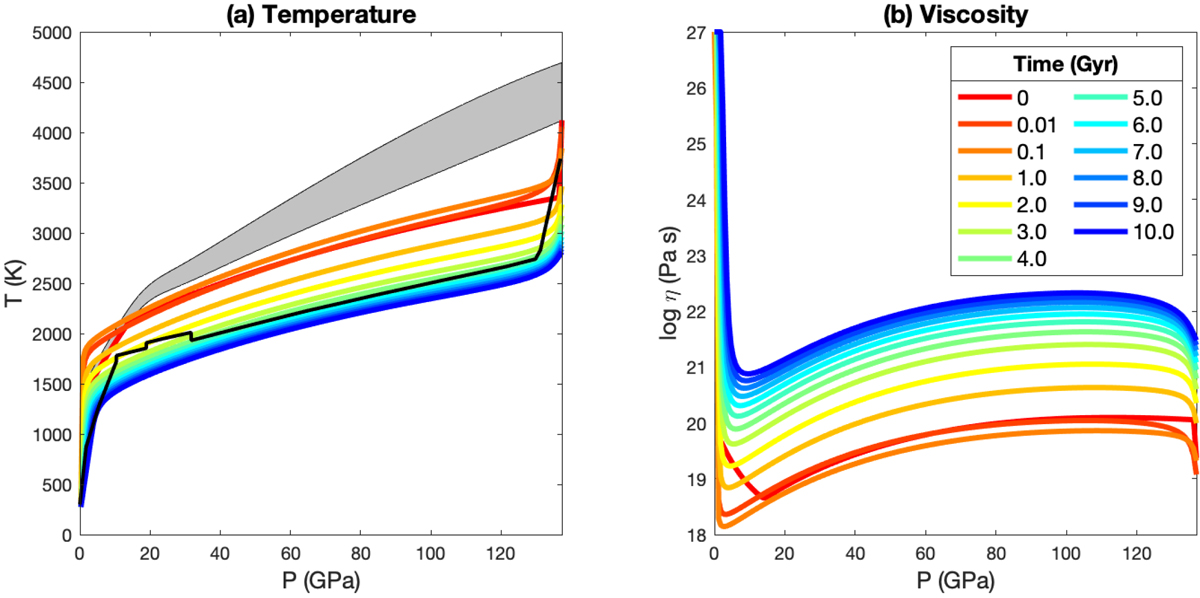
Evolution of (a) mantle temperature and (b) viscosity fora terrestrial planet with Earth-like composition (Mg/Si = 1.2, 8 wt% FeO) as a function of pressure (GPa), ranging from the surface (0 GPa) to the core–mantle boundary (138 GPa, 2891 km). In panel a, the solidus and liquidus from Andrault et al. (2011) are shown as thin black lines that bound a grey area; the temperature profile of the modern Earth is shown as a thick black line (Stacey & Davis 2008).
Current usage metrics show cumulative count of Article Views (full-text article views including HTML views, PDF and ePub downloads, according to the available data) and Abstracts Views on Vision4Press platform.
Data correspond to usage on the plateform after 2015. The current usage metrics is available 48-96 hours after online publication and is updated daily on week days.
Initial download of the metrics may take a while.