Fig. 5
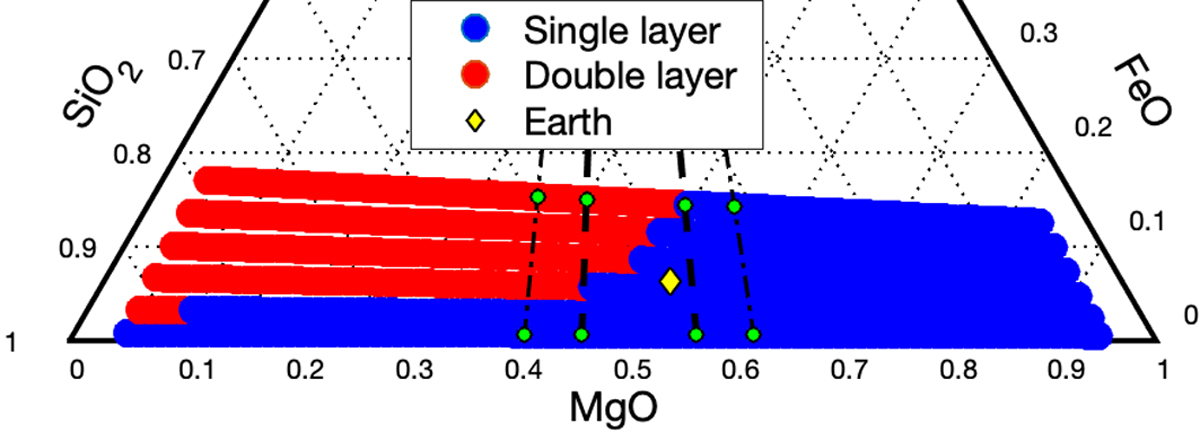
Predicted stratification of the mantle after overturn as a function of bulk mantle composition in terms of molar MgO, FeO, and SiO2, assuming Δρcrit = 225 kg m−3. Blue and red dots denote cases with density differences across the mantle smaller than and larger than Δρcrit (i.e., with a well-mixed and stably stratified mantle), respectively. Composition is shown for a range of bulk mantle Mg/Si from 0.05 to 20, and FeO from 1 to 20 wt%. The 1σ and 2σ ranges of Mg/Si-ratios from the Hypatia catalog are shown as vertical dashed and dot-dashed lines, respectively. Green dots on these lines correspond to compositions shown in Table 1. The yellow diamond shows Earth’s mantle composition (McDonough 2003).
Current usage metrics show cumulative count of Article Views (full-text article views including HTML views, PDF and ePub downloads, according to the available data) and Abstracts Views on Vision4Press platform.
Data correspond to usage on the plateform after 2015. The current usage metrics is available 48-96 hours after online publication and is updated daily on week days.
Initial download of the metrics may take a while.