Fig. A.1.
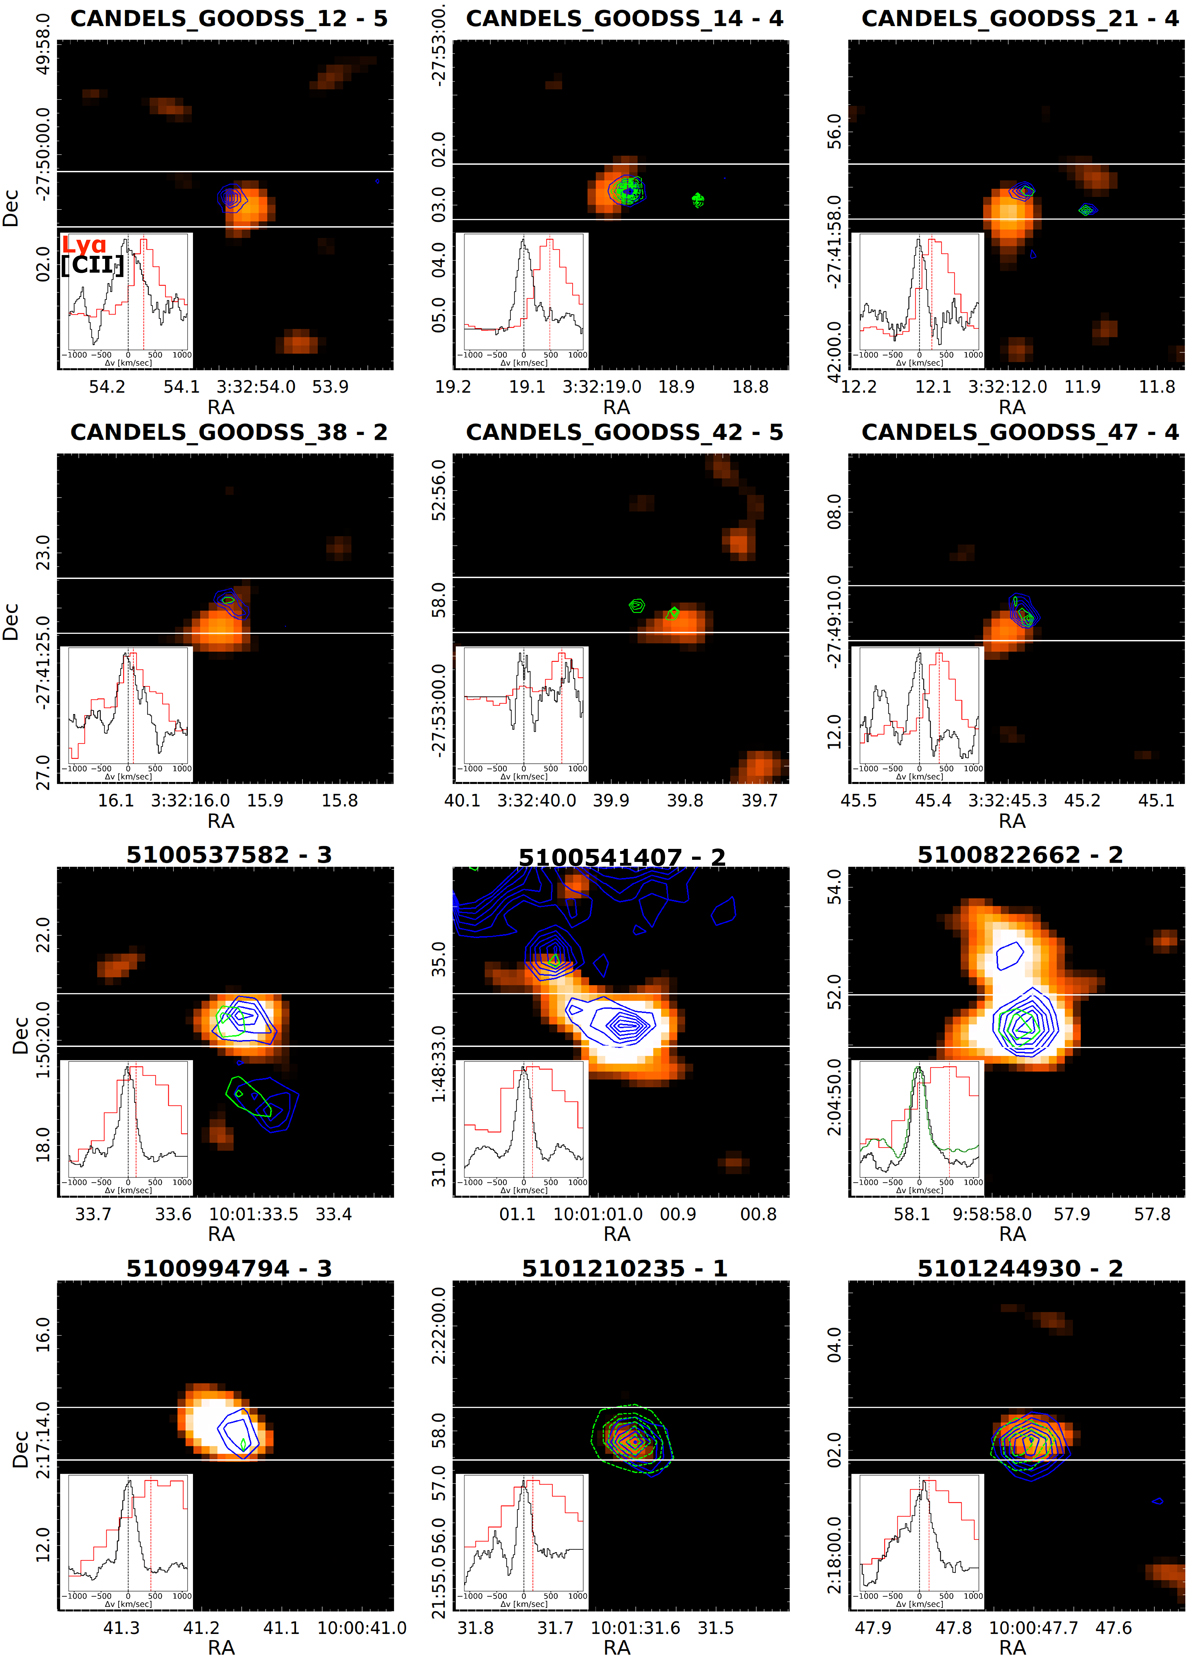
Velocity-integrated [CII] flux maps. The green contours represent the emission in the filter where the Lyα line falls in: i+ or r+ SUBARU bands, depending on the redshift of the source. The blue contours mark the emission in the ULTRAVISTA Ks filter. Solid contours are drawn at steps of 1σ, while dashed contours are at steps of 2σ, both starting from 3σ. The white lines mark the position of the spectral slit. The plot in the bottom left corner represents the [CII] (black) and Lyα (red) lines. The code next to the object name in the top label indicates the morpho-kinematic class from Le Fèvre et al. (2020): 1.0 are rotators; 2.0 are mergers; 3.0 are extended [CII] emitters, dispersion dominated; 4.0 are compact, dispersion dominated; and 5.0 are faint [CII] emitters.
Current usage metrics show cumulative count of Article Views (full-text article views including HTML views, PDF and ePub downloads, according to the available data) and Abstracts Views on Vision4Press platform.
Data correspond to usage on the plateform after 2015. The current usage metrics is available 48-96 hours after online publication and is updated daily on week days.
Initial download of the metrics may take a while.