Fig. 5.
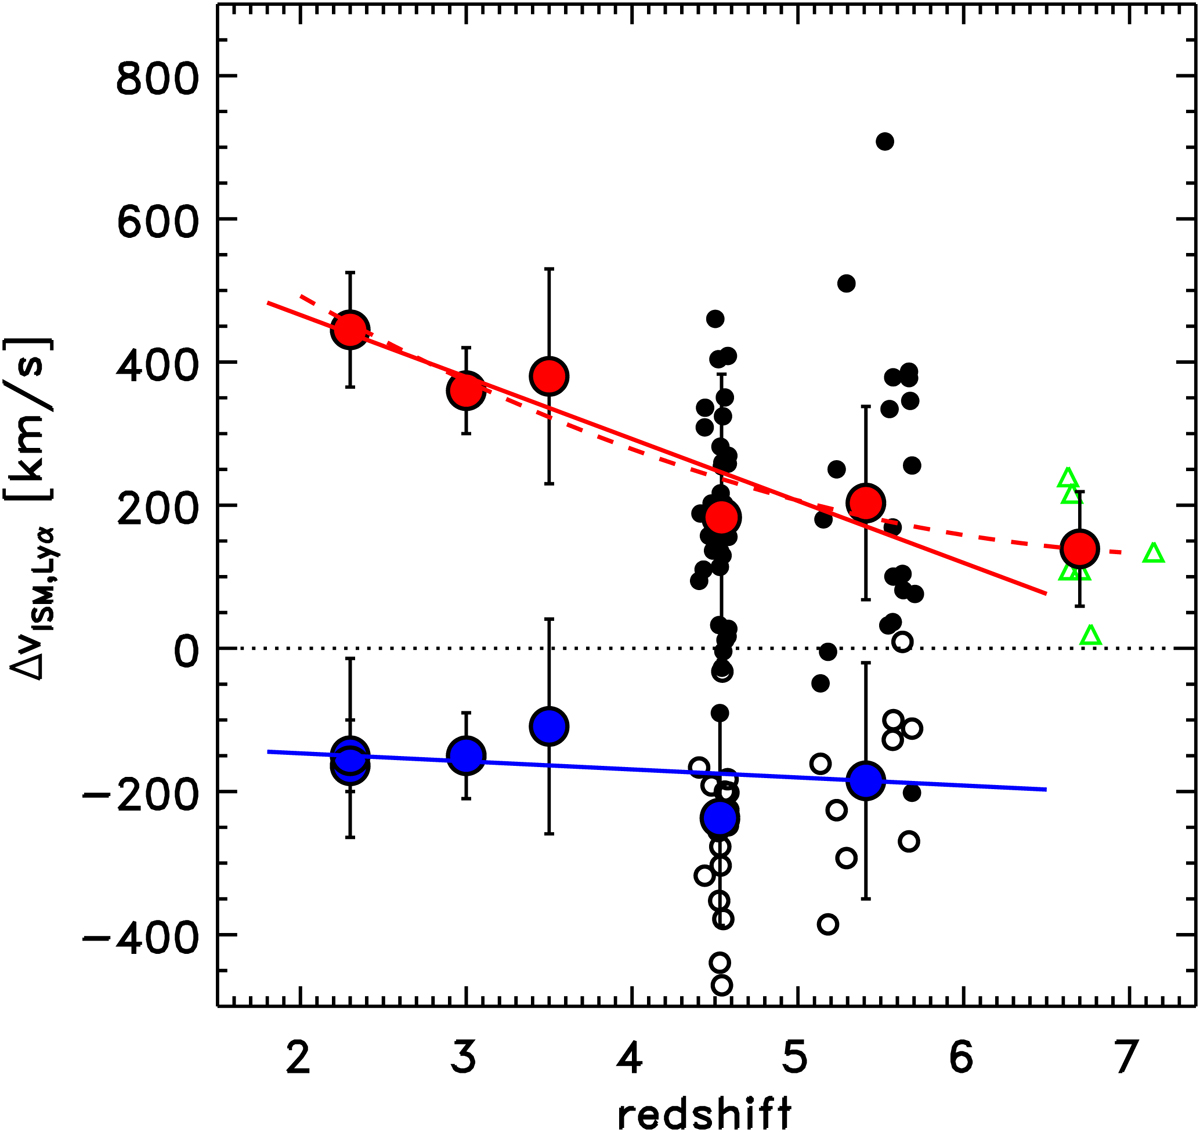
Evolution of the Lyα and ISM offsets with redshift. We report individual measurements for our sample (filled and empty symbols indicate ΔLyα and ΔISM, respectively), and for galaxies at z ∼ 7 (green triangles, from Pentericci et al. 2016; Bradač et al. 2017; Matthee et al. 2019). Red and blue circles indicate the average values of ΔLyα and ΔISM for different samples at different redshifts: the values at z ∼ 2.3 are from Steidel et al. (2010); at z ∼ 2.3 (for the ISM alone) they are from Talia et al. (2017); at z ∼ 3 they are from the stacked spectrum in Shapley et al. (2003); at z ∼ 3.5 they are from Marchi et al. (2019); at z ∼ 4.5 and 5.5 they are from this work; and at z ∼ 7 they are for Lyα alone from Pentericci et al. (2016), Bradač et al. (2017), and Matthee et al. (2019). The blue and red continuous lines are linear best fits to the points. In the bottom panel we also report second-degree polynomial fit that also incorporates the z ∼ 7 data well.
Current usage metrics show cumulative count of Article Views (full-text article views including HTML views, PDF and ePub downloads, according to the available data) and Abstracts Views on Vision4Press platform.
Data correspond to usage on the plateform after 2015. The current usage metrics is available 48-96 hours after online publication and is updated daily on week days.
Initial download of the metrics may take a while.