Fig. 4.
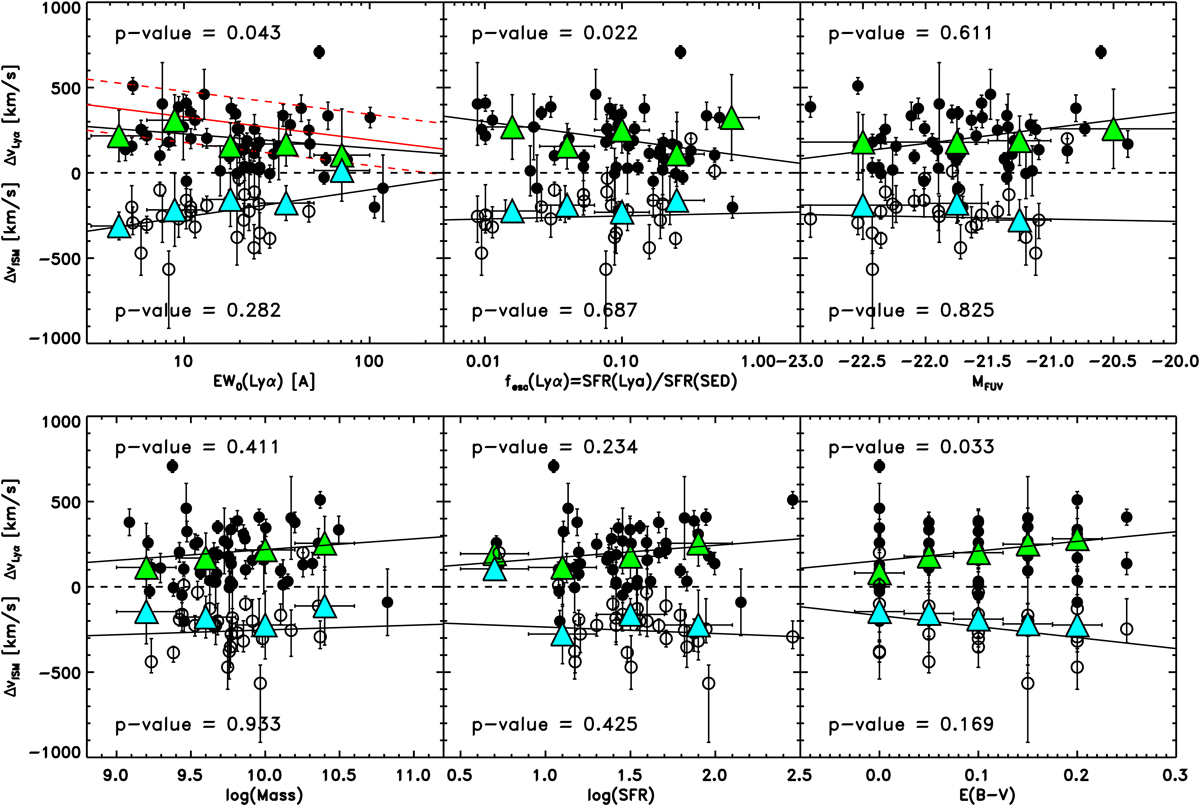
Velocity offset between Lyα and [CII] (filled circles) and between ISM and [CII] (empty circles) as a function of EW0(Lyα) (top left panel), fesc(Lyα) (top central panel), absolute magnitude in the far-UV MFUV (top right panel), stellar mass (bottom left panel), SFR (bottom central panel), and E(B − V)* (bottom right panel). The green (cyan) triangles show the running median of the Lyα (ISM) offset in bins of EW0(Lyα), fesc(Lyα), redshift, stellar mass, SFR, and E(B − V)*. The error bars on the offset velocity mainly reflect the spectral resolution of the optical spectra: smaller error bars are for objects from DEIMOS, which have R ∼ 2000, while larger bars are in general from VIMOS/VUDS spectroscopy, which has a lower spectral resolution (R ∼ 230). The continuous lines are linear fits to the black points, and the p-value of the Spearman rank test (the probability of no correlation) is reported in each panel. In the first panel (ΔvLyα vs. EW0(Lyα) we show in red the correlation between the two quantities reported in Erb et al. (2014): the continuous line is our best fit to the data in their Fig. A.1, and the dashed lines contain 68% of their data points.
Current usage metrics show cumulative count of Article Views (full-text article views including HTML views, PDF and ePub downloads, according to the available data) and Abstracts Views on Vision4Press platform.
Data correspond to usage on the plateform after 2015. The current usage metrics is available 48-96 hours after online publication and is updated daily on week days.
Initial download of the metrics may take a while.