Fig. 1.
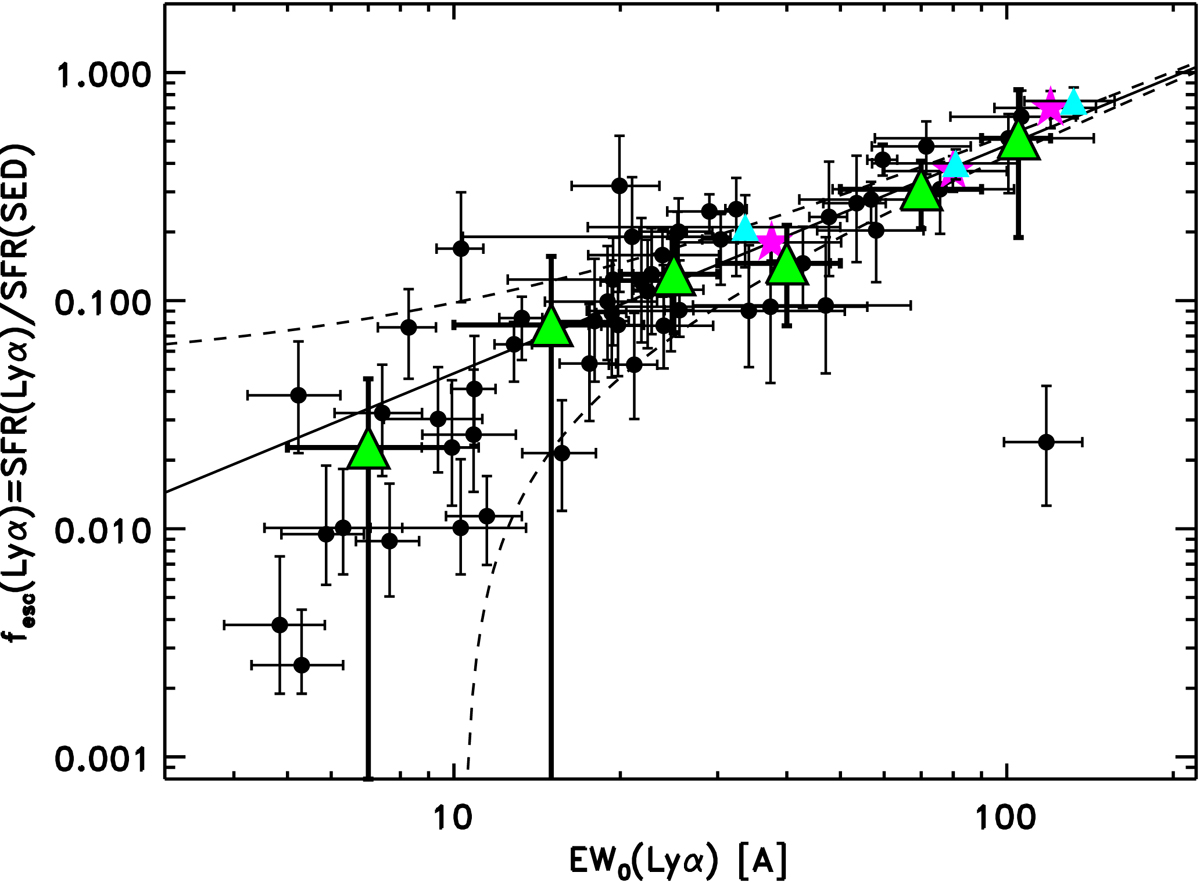
fesc(Lyα) as a function of EW0(Lyα) for the galaxies in this sample. Green triangles show fesc(Lyα) in bins of EW0(Lyα). Cyan triangles and magenta stars are the average values for samples at z ∼ 2.2 and z ∼ 2.6 by Sobral et al. (2017) and Trainor et al. (2016), respectively, and the black solid and dashed lines indicate the empirical fit fesc(Lyα) = 0.0048 × EW0 ± 0.05 proposed by Sobral & Matthee (2019).
Current usage metrics show cumulative count of Article Views (full-text article views including HTML views, PDF and ePub downloads, according to the available data) and Abstracts Views on Vision4Press platform.
Data correspond to usage on the plateform after 2015. The current usage metrics is available 48-96 hours after online publication and is updated daily on week days.
Initial download of the metrics may take a while.