Fig. A.1
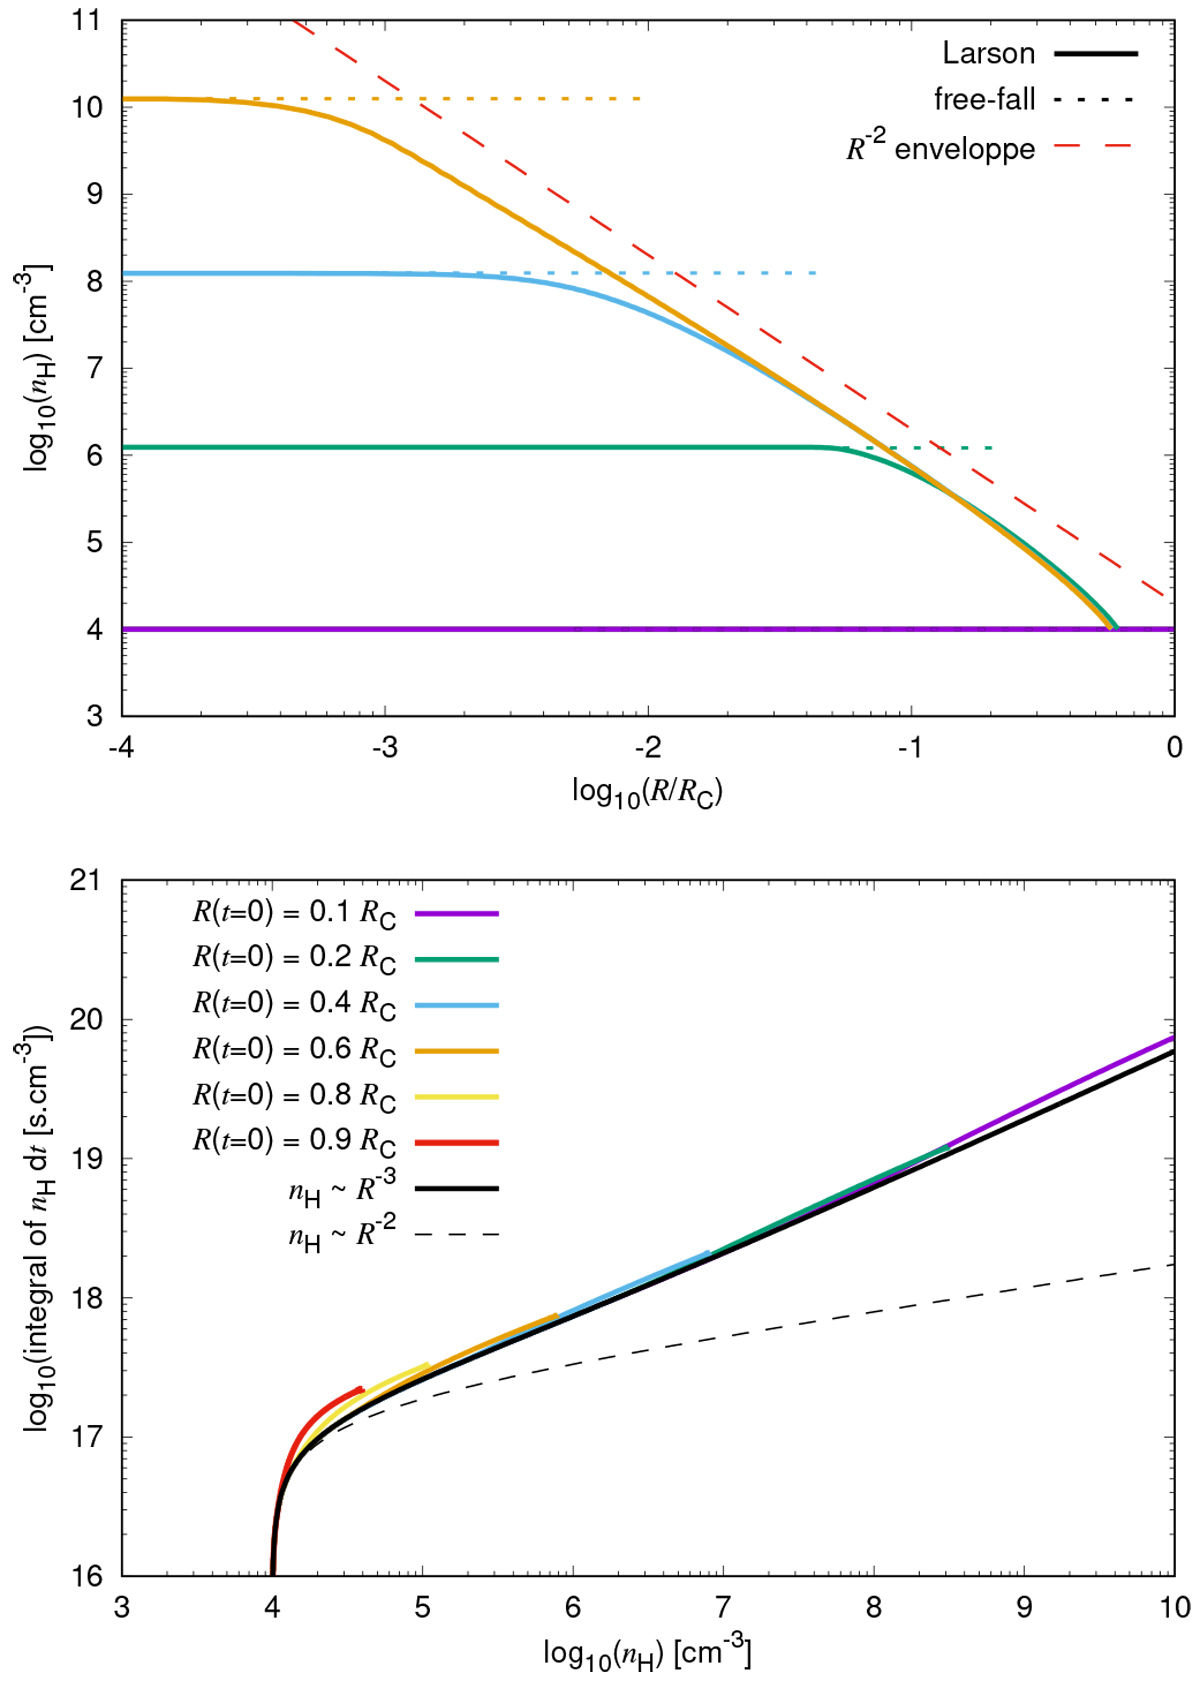
Top: density profile of the collapsing cloud at four stages of its evolution for the Larson (Larson 1969) scenario (thick lines), and for our simple collapse model of Sect. 2.2. Bottom: ∫ nH d t for the Larson collapse for gas cells distributed at different radius before the cloud collapse. Results for models of uniform compression assuming nH ∝ R−3 (black thick line) and nH ∝ R−2 (black thin line) are over-plotted.
Current usage metrics show cumulative count of Article Views (full-text article views including HTML views, PDF and ePub downloads, according to the available data) and Abstracts Views on Vision4Press platform.
Data correspond to usage on the plateform after 2015. The current usage metrics is available 48-96 hours after online publication and is updated daily on week days.
Initial download of the metrics may take a while.