Fig. C.1
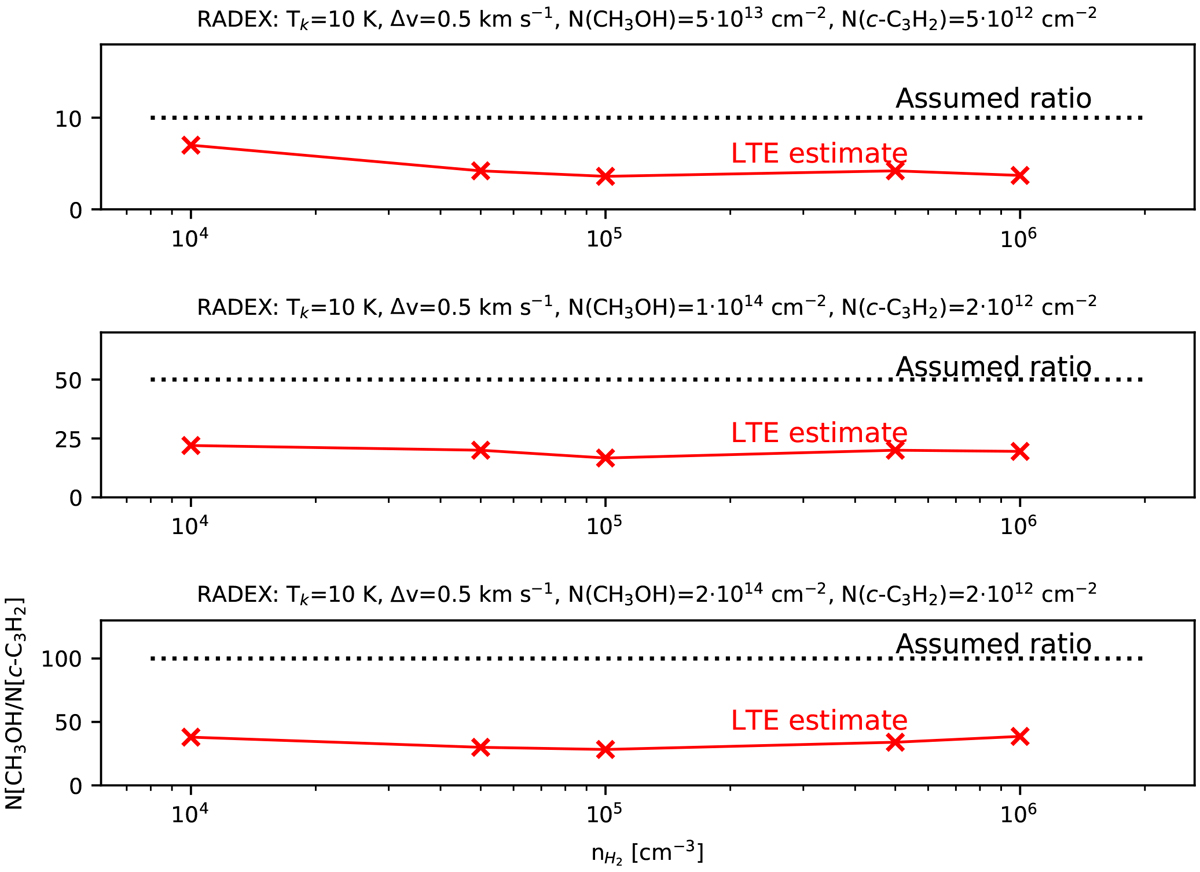
Variation of non-LTE effects on the N(CH3OH)/N(c-C3H2) abundance ratio at different volume densities. The intensities of the 21,2–11,1 (E2) methanol line and the 20,2−10,1 cyclopropenylidene line were calculated using RADEX at different volume densities, and assuming different ratios (shown as a horizontal dashed line in each panel). The parameters used for the RADEX calculations are shown at the top of each panel. The red crosses show the abundance ratios resulting from the column densities that have been calculated to reproduce the intensities derived with RADEX, assuming LTE and Tex = 10 K.
Current usage metrics show cumulative count of Article Views (full-text article views including HTML views, PDF and ePub downloads, according to the available data) and Abstracts Views on Vision4Press platform.
Data correspond to usage on the plateform after 2015. The current usage metrics is available 48-96 hours after online publication and is updated daily on week days.
Initial download of the metrics may take a while.