Open Access
Fig. B.1
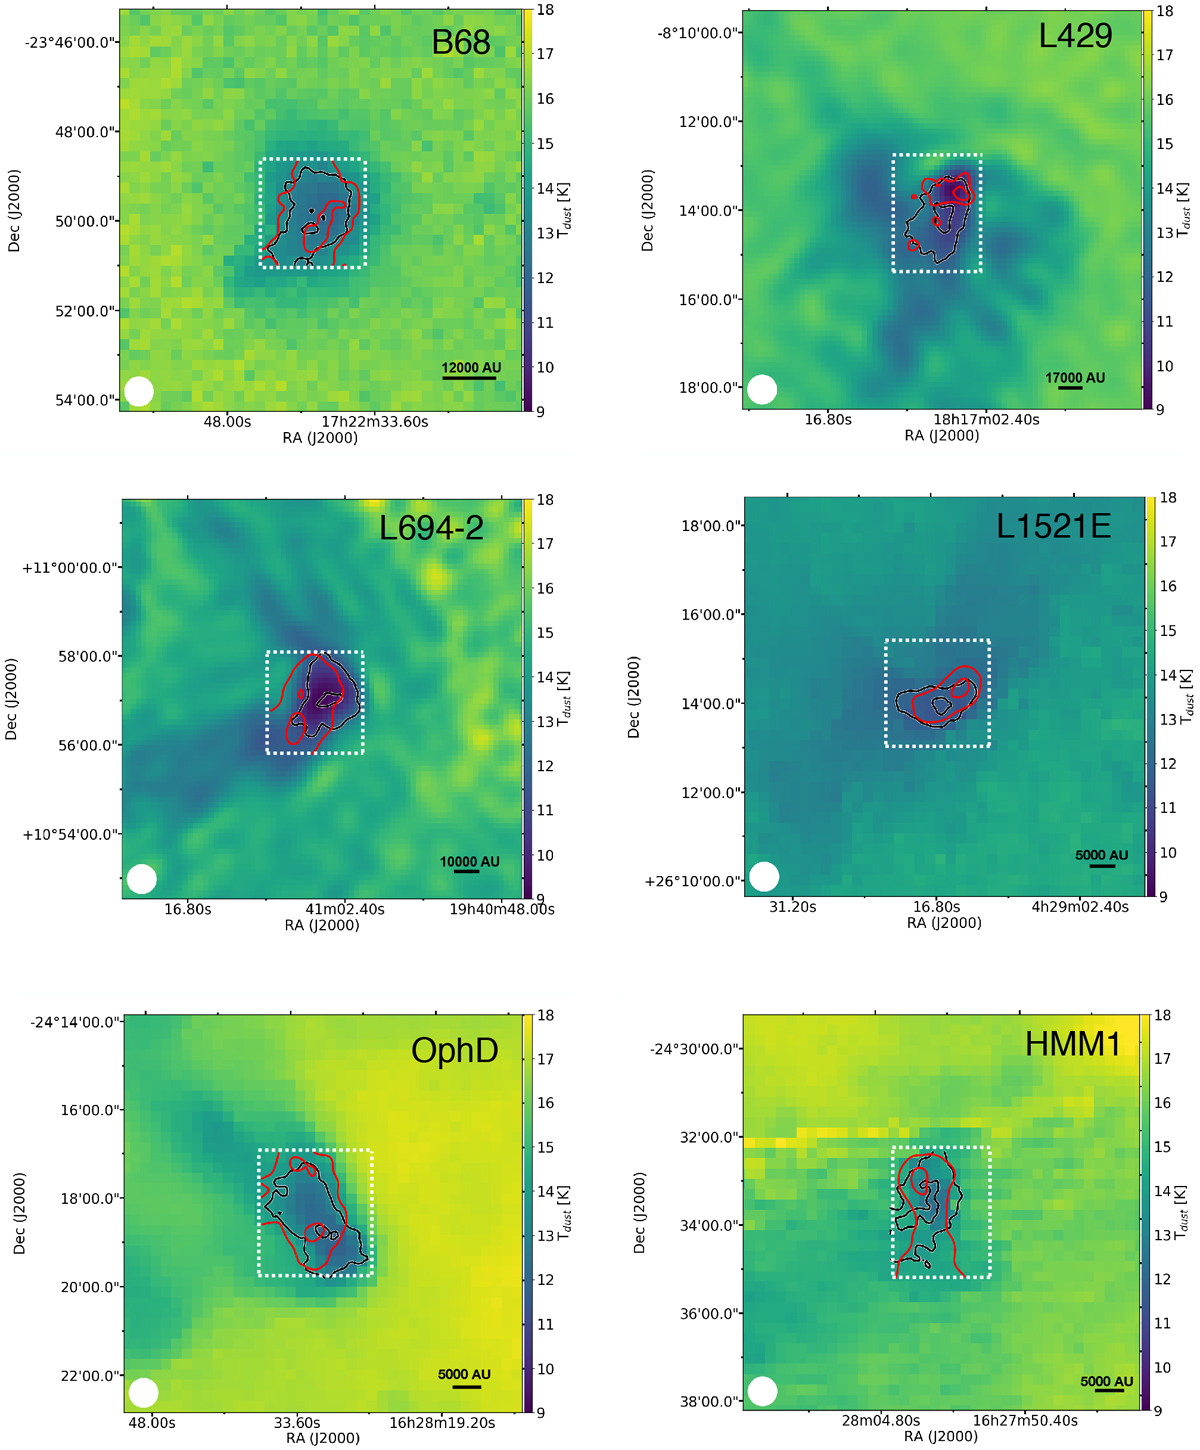
Tdust maps computed from Herschel SPIRE data. The red and black contours represent 90 and 50% of the integrated intensity peak of CH3OH and c-C3H2, respectively.The dotted white box indicates the region mapped with the 30 m telescope.
Current usage metrics show cumulative count of Article Views (full-text article views including HTML views, PDF and ePub downloads, according to the available data) and Abstracts Views on Vision4Press platform.
Data correspond to usage on the plateform after 2015. The current usage metrics is available 48-96 hours after online publication and is updated daily on week days.
Initial download of the metrics may take a while.