Fig. A.1
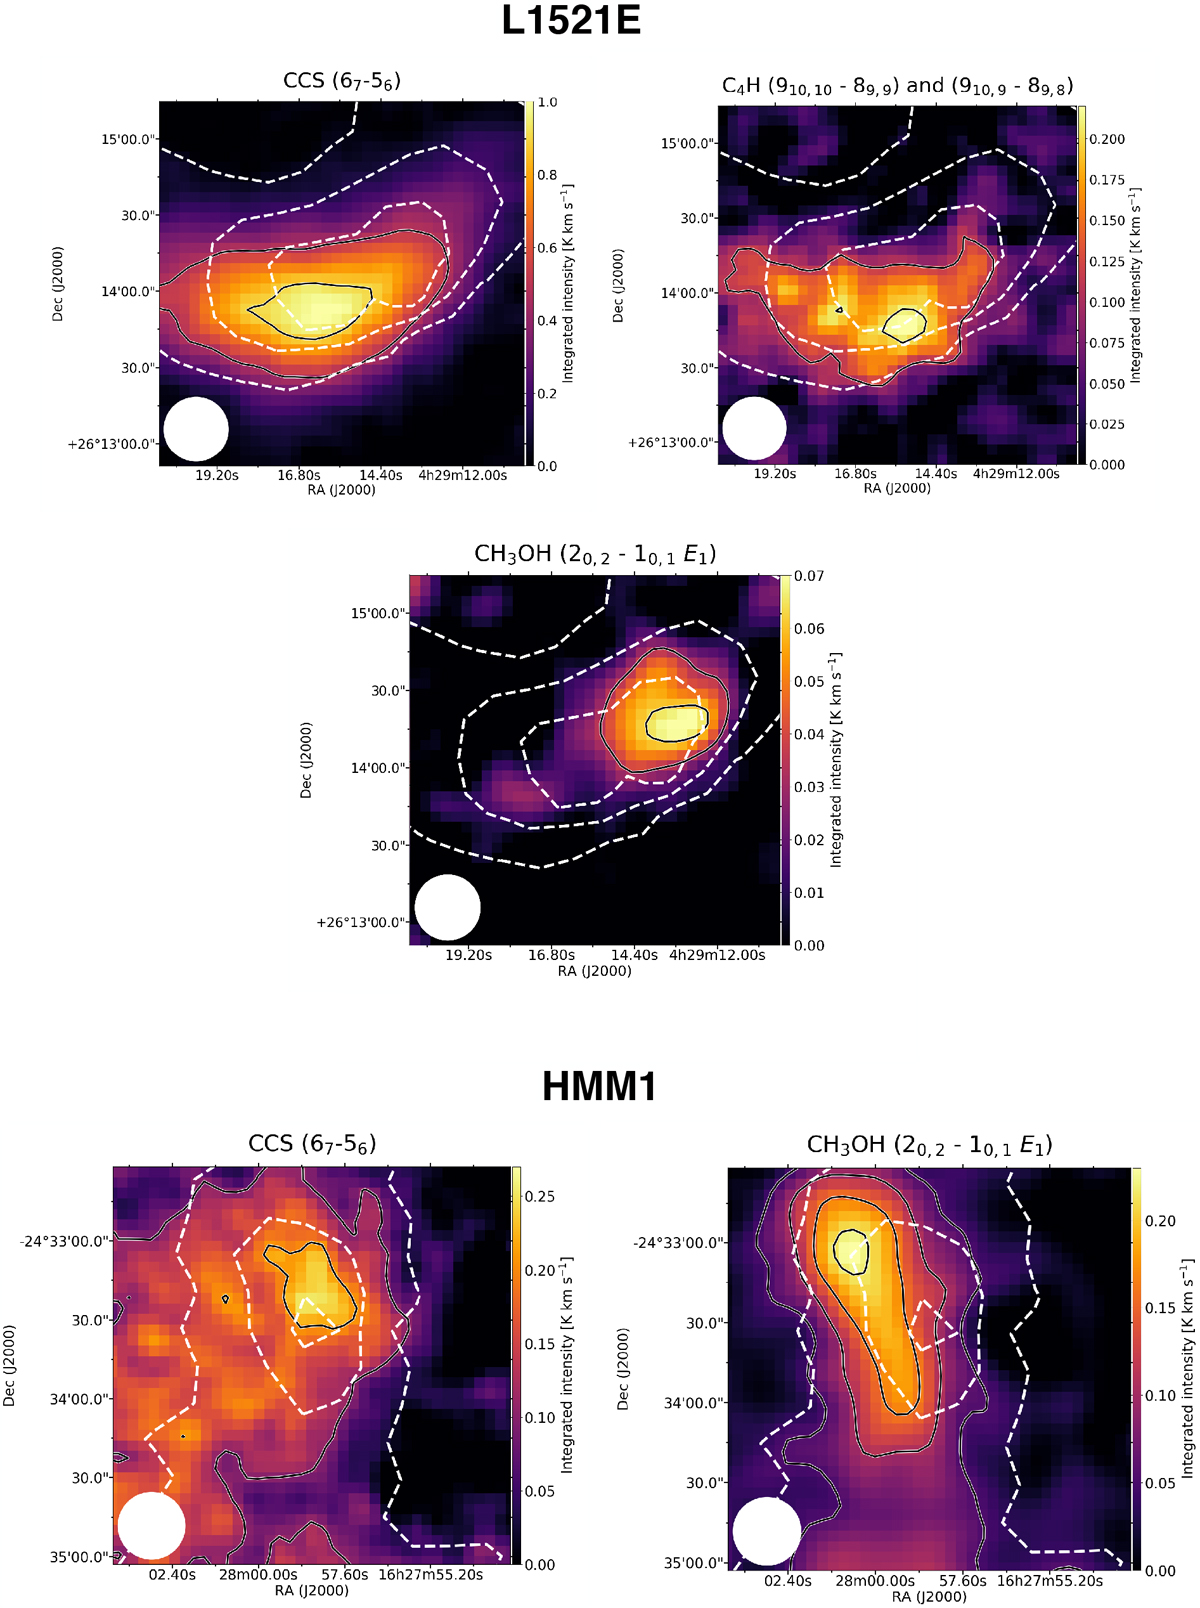
Integrated emission maps of CCS and C4H towards the sources in our sample. The solid line contours indicate 90 and 50% of the integrated intensity peak with the exception of the C4H transition in L429, where the contours indicate 90 and 70% of the integrated intensity peak. The dashed line contours represent the AV values computed from the Herschel/SPIRE maps (5, 10, and 15 mag for B68; 20, 40, and 70 mag for L429; 10, 15, and 20 mag for L1521E; 20, 40, and 80 mag for L694-2; 20, 40, and 60 mag for HMM-1; 20, 30, and 40 mag for OphD). The white circle in the bottom left of each panel shows the 40′′ beam of the SPIRE data.
Current usage metrics show cumulative count of Article Views (full-text article views including HTML views, PDF and ePub downloads, according to the available data) and Abstracts Views on Vision4Press platform.
Data correspond to usage on the plateform after 2015. The current usage metrics is available 48-96 hours after online publication and is updated daily on week days.
Initial download of the metrics may take a while.