Open Access
Fig. 4
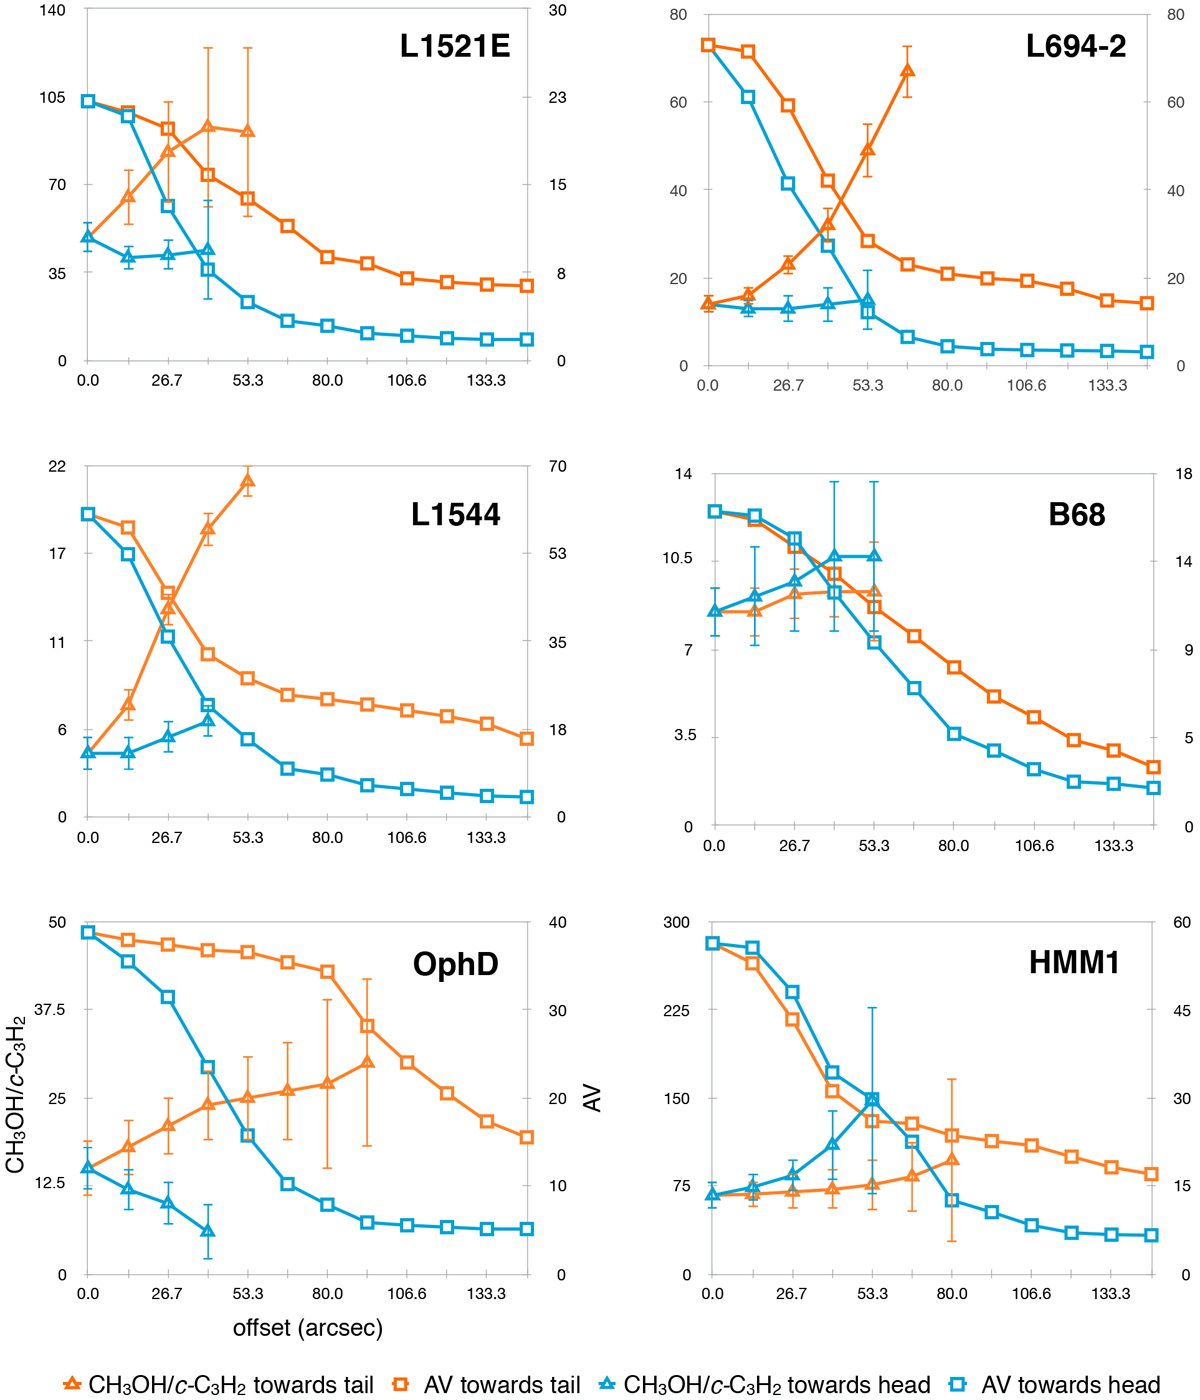
N(CH3OH)/N(c-C3H2) abundance ratios and the visual extinction AV extracted towards both the tail and the head in all the cores in our sample. The dotted white arrows in Fig. 2 indicate the directions in which the abundances profiles were extracted.
Current usage metrics show cumulative count of Article Views (full-text article views including HTML views, PDF and ePub downloads, according to the available data) and Abstracts Views on Vision4Press platform.
Data correspond to usage on the plateform after 2015. The current usage metrics is available 48-96 hours after online publication and is updated daily on week days.
Initial download of the metrics may take a while.