Fig. 2.
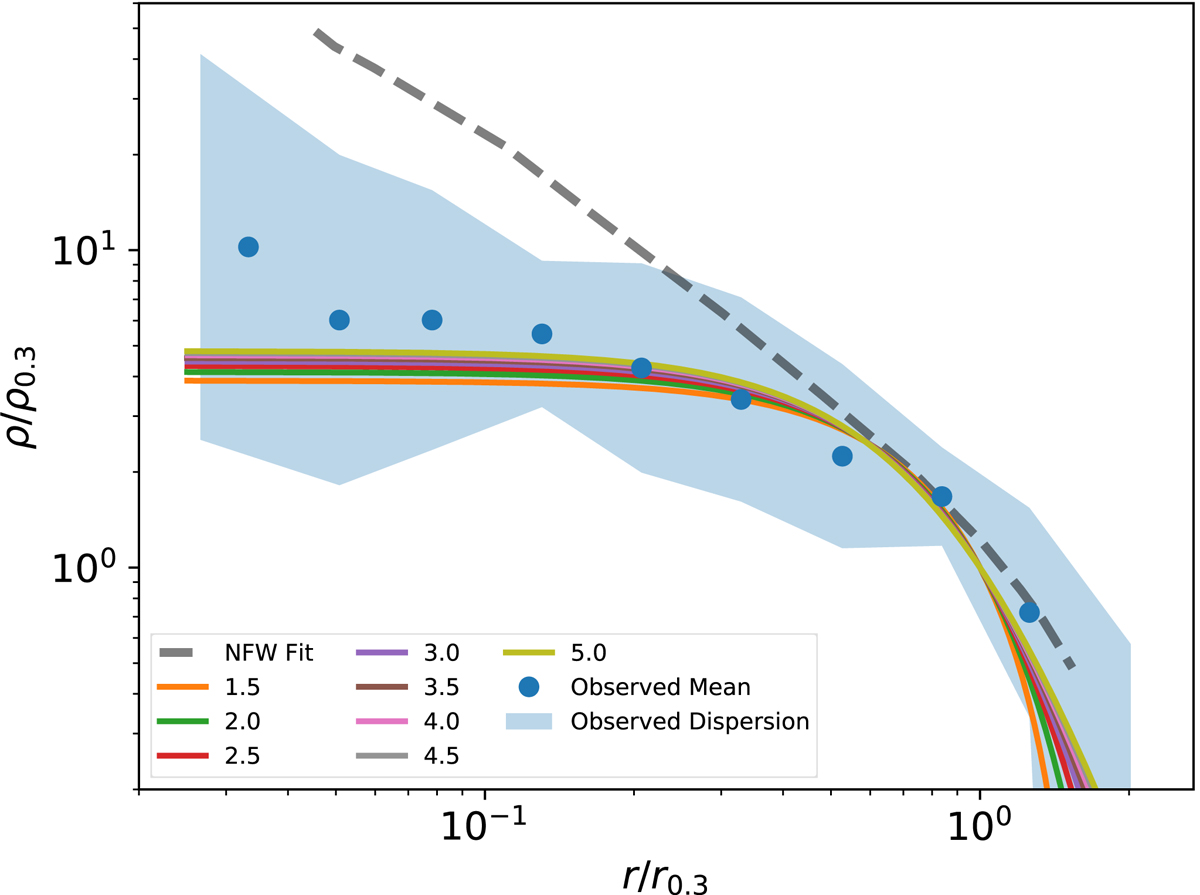
Density profile observed in the inner regions of the 26 “Little Things” galaxies from Oh et al. (2015) (blue symbols and blue region give the mean and the root mean square (RMS) dispersion among the different objects). To reduce scatter, the observed densities and radii are normalized to the density and radius where the logarithmic derivative of the circular velocity equals 0.3 (d log vc/d log r = 0.3), denoted as ρ0.3 and r0.3, respectively. Polytropes are parameter-free in this representation (solid lines with the corresponding indexes given in the inset). The dashed line gives a best-fit to the observed density using a Navarro-Frenk-White (NFW) profile (Oh et al. 2015), which does not follow the observed core.
Current usage metrics show cumulative count of Article Views (full-text article views including HTML views, PDF and ePub downloads, according to the available data) and Abstracts Views on Vision4Press platform.
Data correspond to usage on the plateform after 2015. The current usage metrics is available 48-96 hours after online publication and is updated daily on week days.
Initial download of the metrics may take a while.