Fig. 12
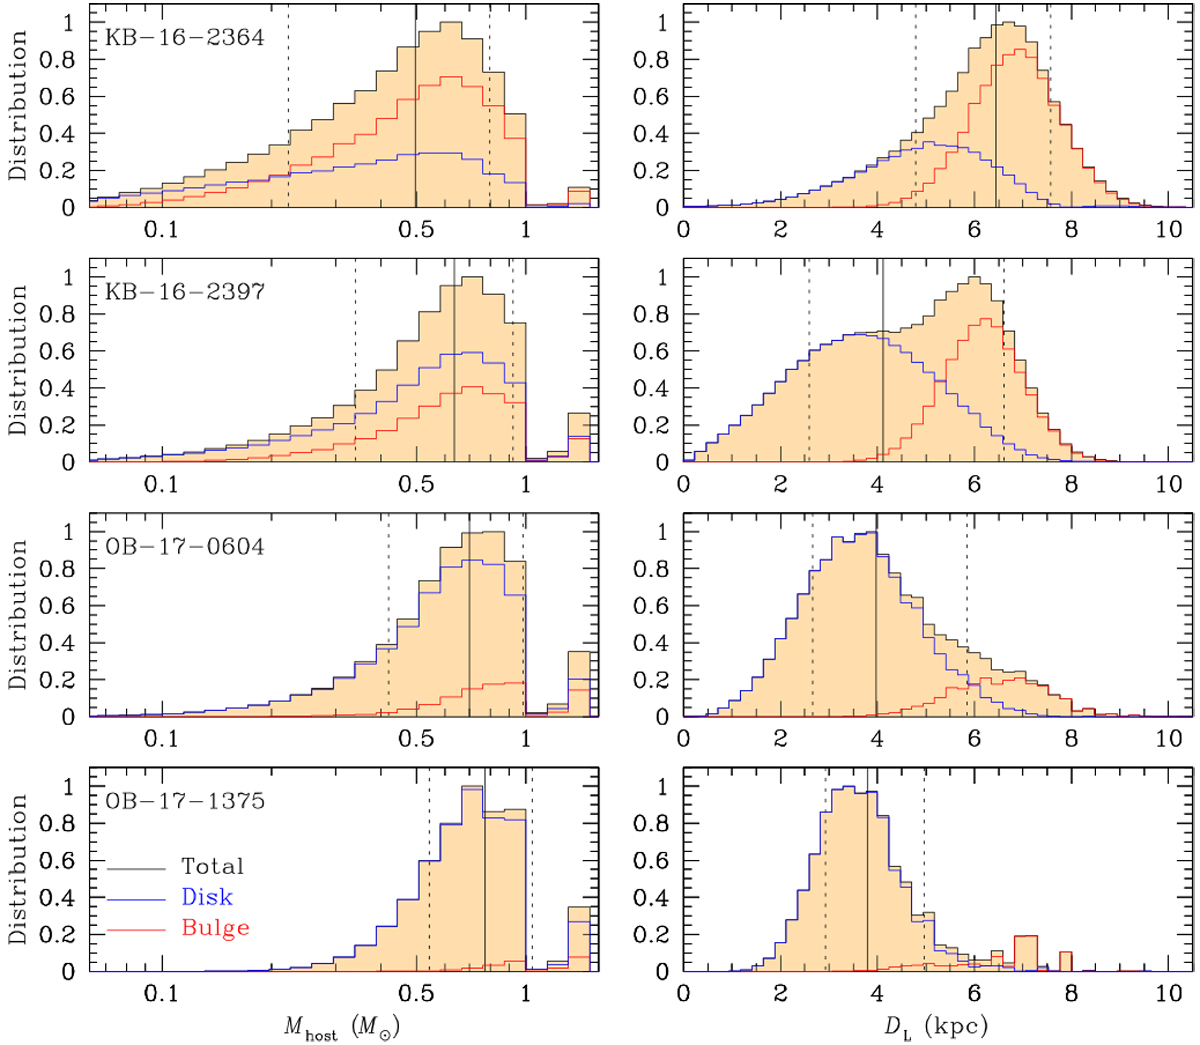
Posteriors of the host mass Mhost (left panels) and the distance DL (right panels) to the lens for the individual events obtained by Bayesian analyses. In each panel, the blue and red distributions represent the contributions by the disk and bulge lens populations, respectively, and the black distribution is the sum of the contributions by two lens populations. The solidvertical line indicates the median value, and the two dotted vertical lines represent the 1σ range of the distribution.
Current usage metrics show cumulative count of Article Views (full-text article views including HTML views, PDF and ePub downloads, according to the available data) and Abstracts Views on Vision4Press platform.
Data correspond to usage on the plateform after 2015. The current usage metrics is available 48-96 hours after online publication and is updated daily on week days.
Initial download of the metrics may take a while.