Fig. 11
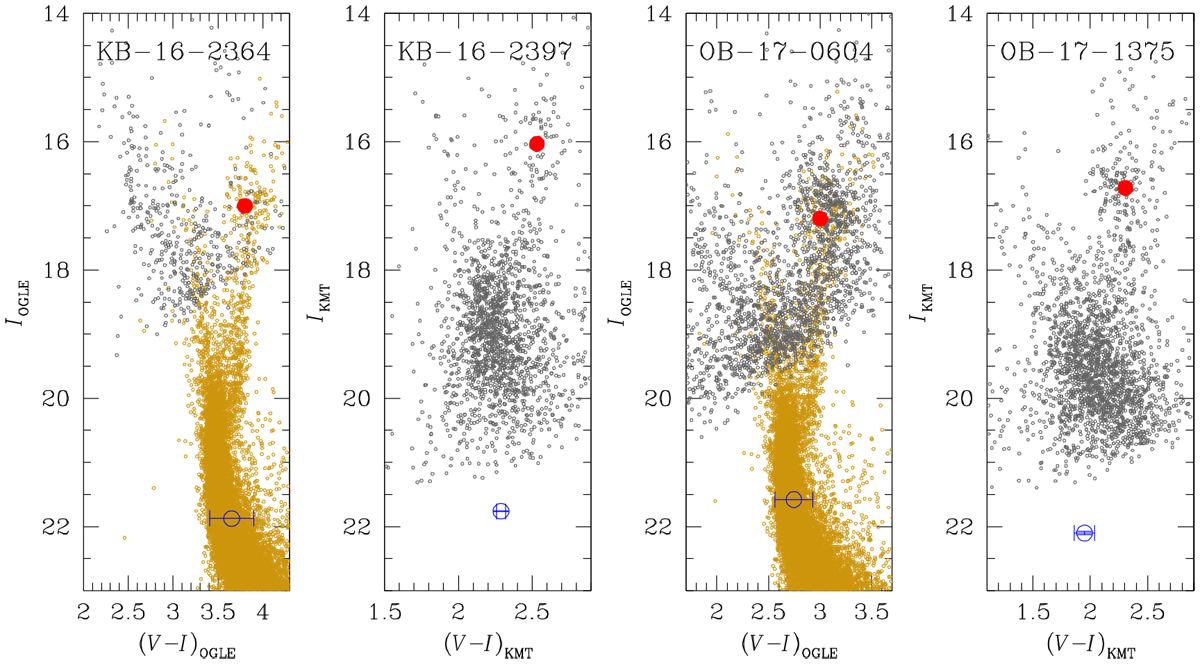
Positions of the source (marked by an empty blue dot with error bars) and RGC centroid (red dot) in the instrumental color-magnitude diagrams. For the events KMT-2016-BLG-2397 and OGLE-2017-BLG-1375, the CMDs are constructed using the pyDIA photometry of the KMTC data set. For KMT-2016-BLG-2364 and OGLE-2017-BLG-0604, the CMDs are based on the combinations of the OGLE (gray points) and HST (yellow points) data sets.
Current usage metrics show cumulative count of Article Views (full-text article views including HTML views, PDF and ePub downloads, according to the available data) and Abstracts Views on Vision4Press platform.
Data correspond to usage on the plateform after 2015. The current usage metrics is available 48-96 hours after online publication and is updated daily on week days.
Initial download of the metrics may take a while.