Fig. 4.
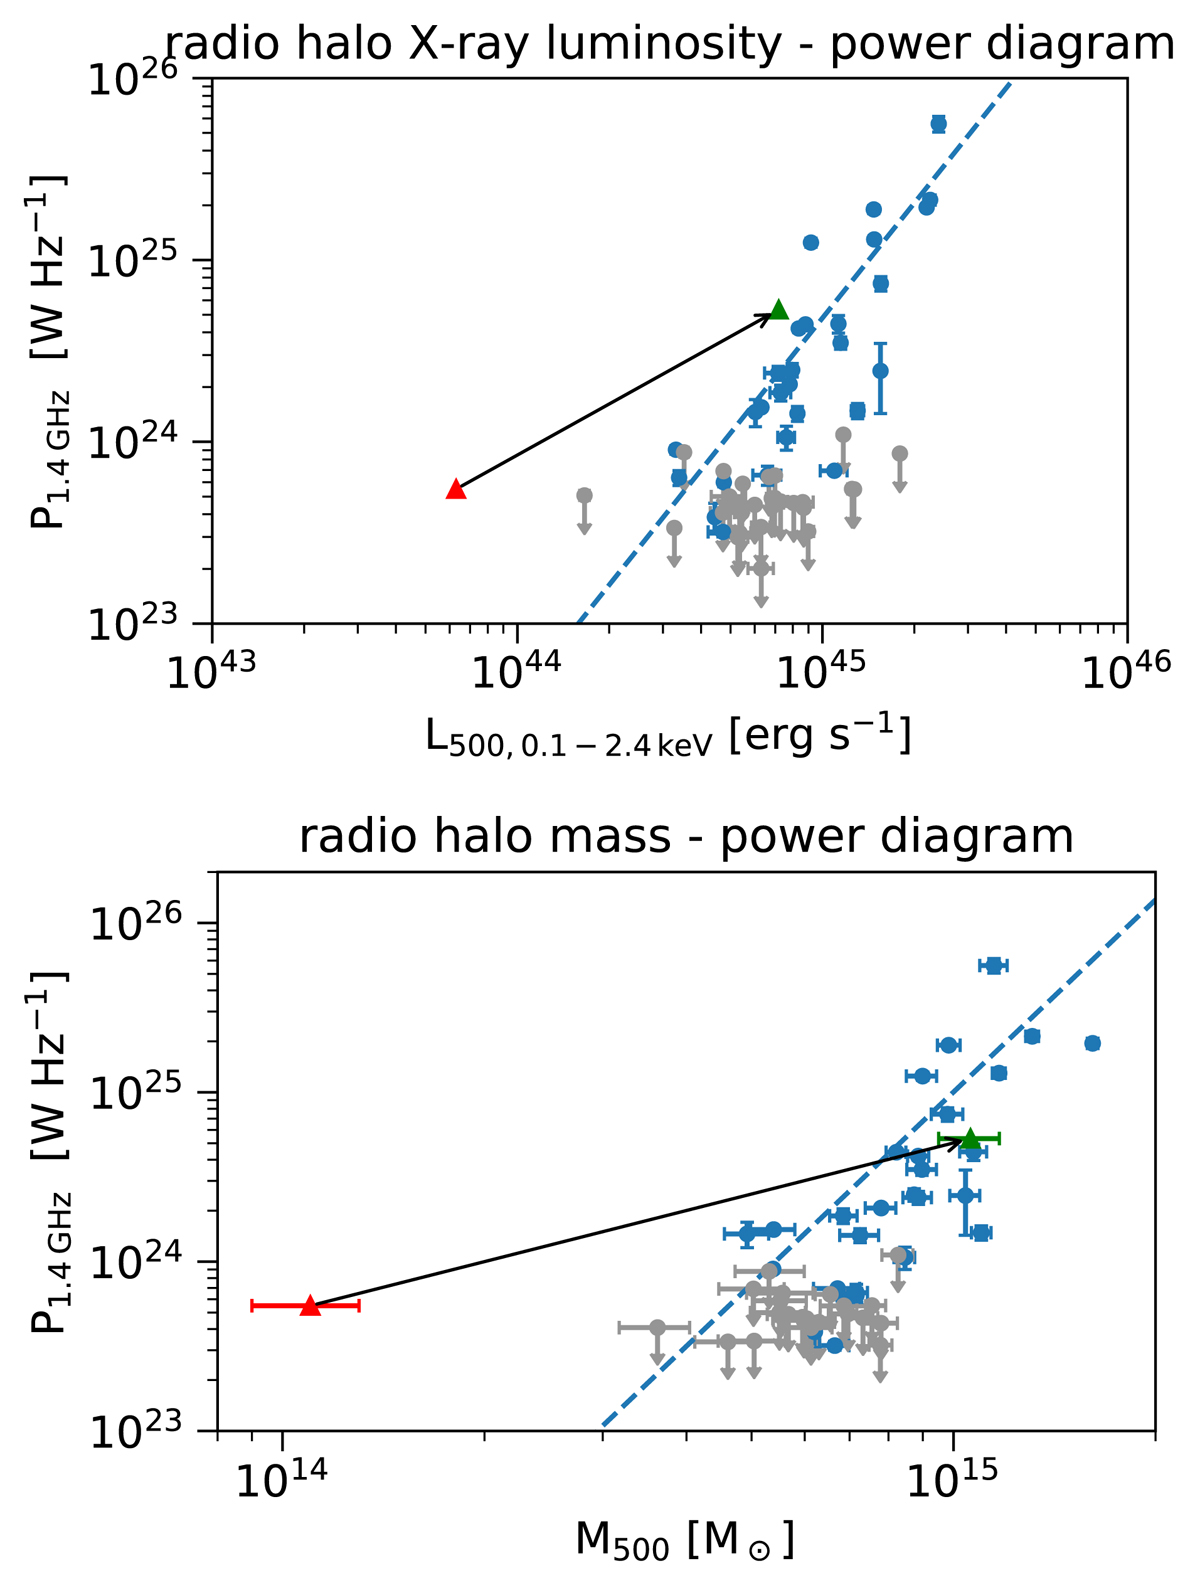
LX − P1.4 GHz (top) and M500 − P1.4 GHz (bottom) diagrams of radio halos. Figures are modified based on the version in van Weeren et al. (2019), where the data samples are from Cassano et al. (2013), Kale et al. (2015) and Cuciti et al. (2018). Blue points are clusters with radio halos and gray upper limits are clusters without radio halos. Blue dashed lines are the best-fit scaling relations from Cassano et al. (2013). The red triangle is ClG 0217+70 using the previous redshift, the green triangle is the corrected value. The error bars of LX and P1.4 GHz of ClG 0217+70 are smaller than the plot symbols.
Current usage metrics show cumulative count of Article Views (full-text article views including HTML views, PDF and ePub downloads, according to the available data) and Abstracts Views on Vision4Press platform.
Data correspond to usage on the plateform after 2015. The current usage metrics is available 48-96 hours after online publication and is updated daily on week days.
Initial download of the metrics may take a while.