Fig. 3.
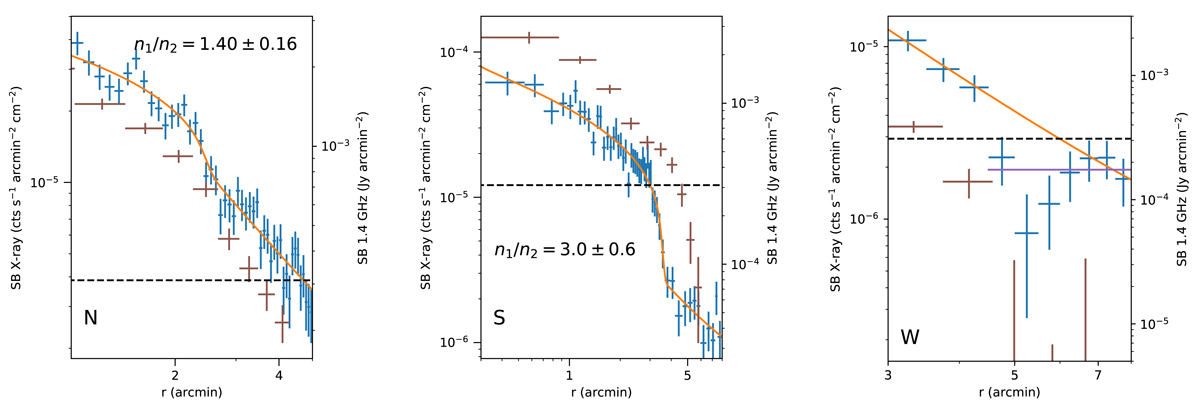
X-ray surface brightness profiles (blue) and the best-fit model (orange) in each extraction region. The radio surface brightness profiles are plotted as brown points. The horizontal dashed line is the 3 × σrms level of the radio map. In the western channel region, in addition to the best-fit power-law model (orange), the constant model after the jump is plotted as the purple line.
Current usage metrics show cumulative count of Article Views (full-text article views including HTML views, PDF and ePub downloads, according to the available data) and Abstracts Views on Vision4Press platform.
Data correspond to usage on the plateform after 2015. The current usage metrics is available 48-96 hours after online publication and is updated daily on week days.
Initial download of the metrics may take a while.