Free Access
Fig. 2.
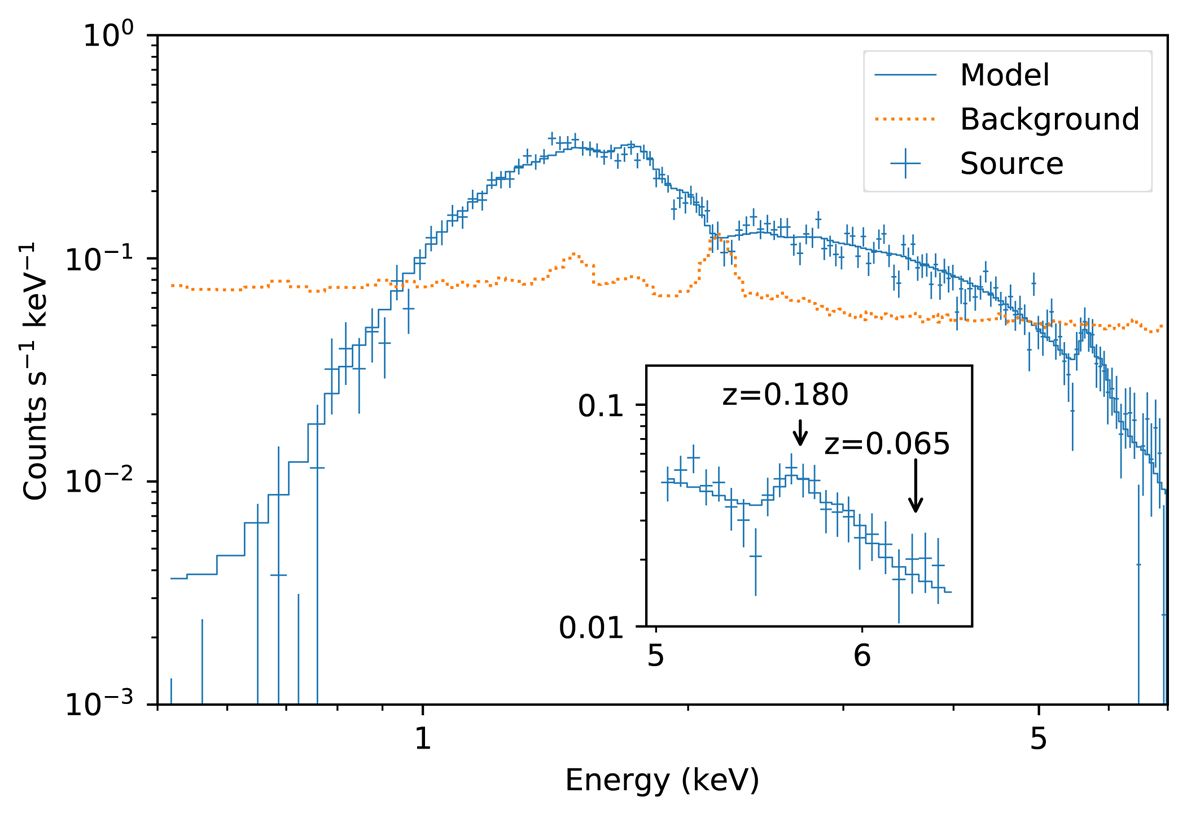
Spectrum inside r500. The dotted line is the blank sky background that is subtracted. The box is a zoomed-in view of the bump that consists of Fe XXV Heα and Fe XXVI Lyα lines. The positions of the Fe XXV Heα line at different redshifts are indicated.
Current usage metrics show cumulative count of Article Views (full-text article views including HTML views, PDF and ePub downloads, according to the available data) and Abstracts Views on Vision4Press platform.
Data correspond to usage on the plateform after 2015. The current usage metrics is available 48-96 hours after online publication and is updated daily on week days.
Initial download of the metrics may take a while.