Fig. 1.
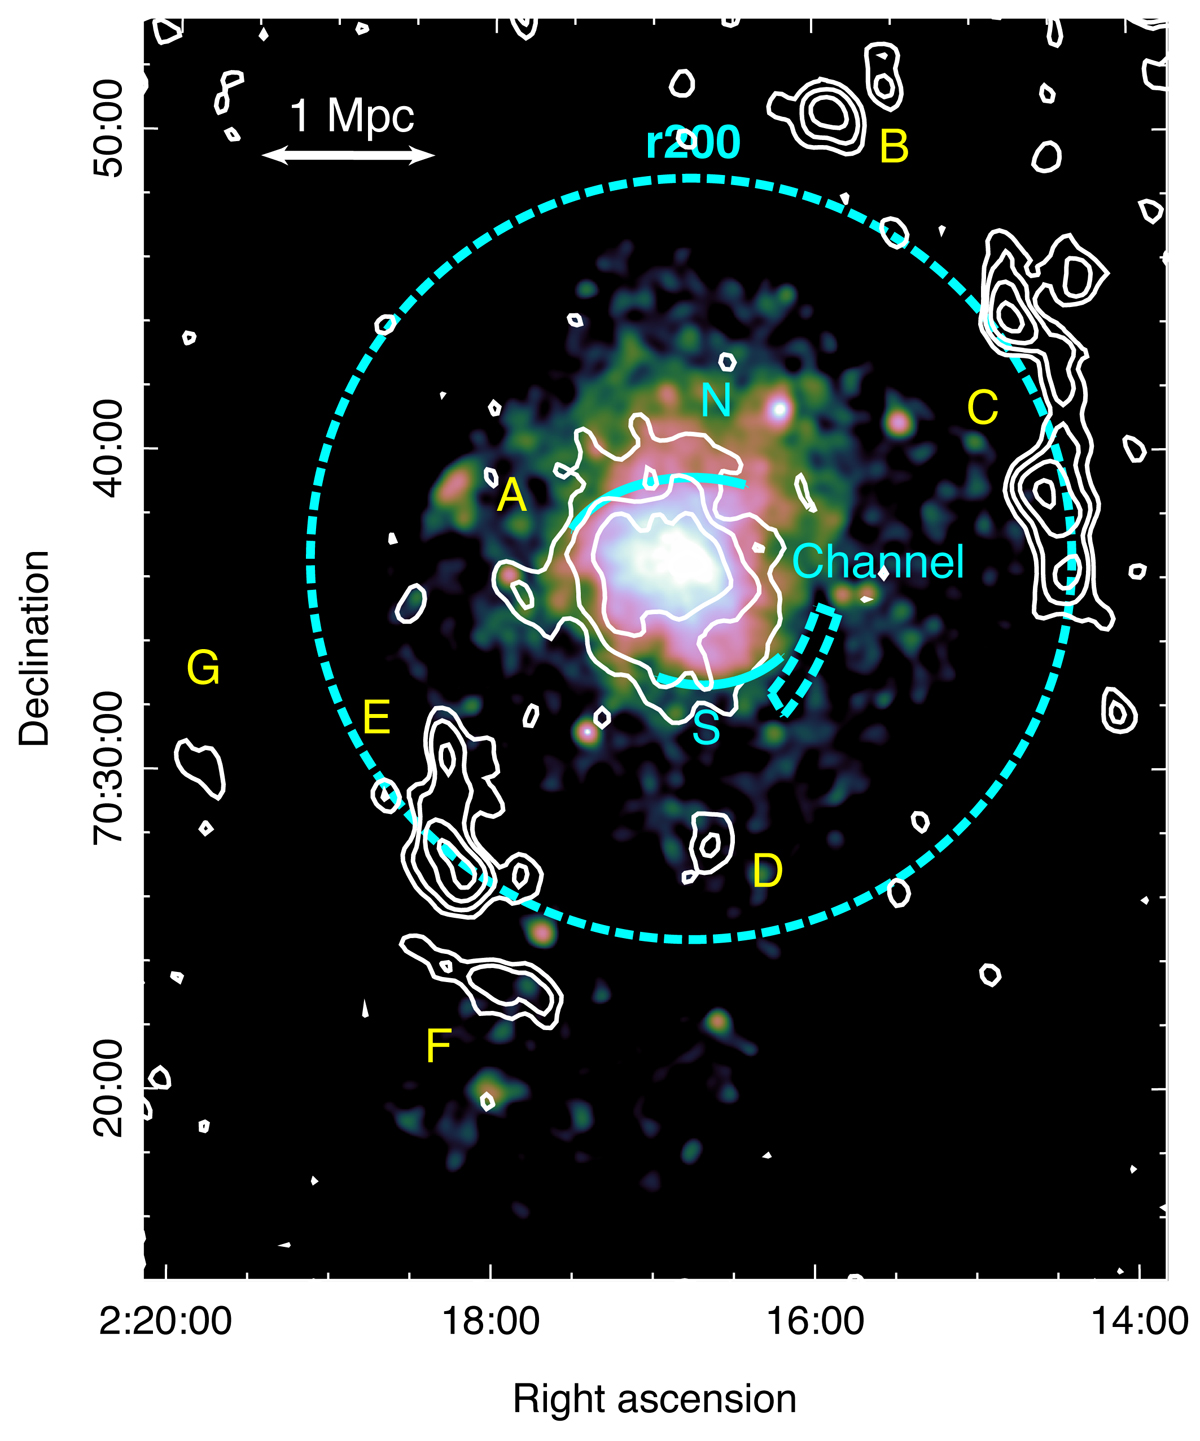
Multi-wavelength view of the merging cluster ClG 0217+70. The color image is the NXB subtracted, vignetting corrected, and adaptively smoothed 1–3 keV Chandra flux map. The white contours are compact source subtracted VLA L-band D configuration radio intensities at 3σrms × [1, 2, 4, 8] levels, where σrms = 70 μJy. Individual diffuse radio sources are labeled following the terms of Brown et al. (2011), where source A is the giant radio halo and B–G are relic candidates. The dashed circle represents r200. The northern and southern X-ray surface brightness discontinuities and the western “channel” are indicated by cyan arcs and an annulus sector.
Current usage metrics show cumulative count of Article Views (full-text article views including HTML views, PDF and ePub downloads, according to the available data) and Abstracts Views on Vision4Press platform.
Data correspond to usage on the plateform after 2015. The current usage metrics is available 48-96 hours after online publication and is updated daily on week days.
Initial download of the metrics may take a while.