Fig. 5
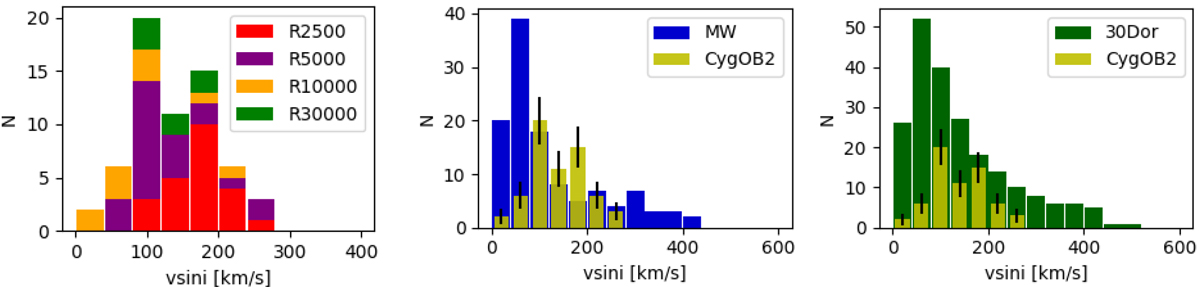
Distribution of rotational velocities of our final sample of 63 O-type isolated stars in Cygnus OB2. Left: histogram color-coded on the basis of the resolving power of the spectra used for each target. Middle: v sin i histogram showing the comparison between the distribution of rotational velocities found for our sample of O-type stars in Cygnus OB2 and the distribution of O-type stars found in the MW. Vertical black lines indicate the associated Poisson noise. Right: as in middle panel but compared to 30 Dor.
Current usage metrics show cumulative count of Article Views (full-text article views including HTML views, PDF and ePub downloads, according to the available data) and Abstracts Views on Vision4Press platform.
Data correspond to usage on the plateform after 2015. The current usage metrics is available 48-96 hours after online publication and is updated daily on week days.
Initial download of the metrics may take a while.