Fig. 9.
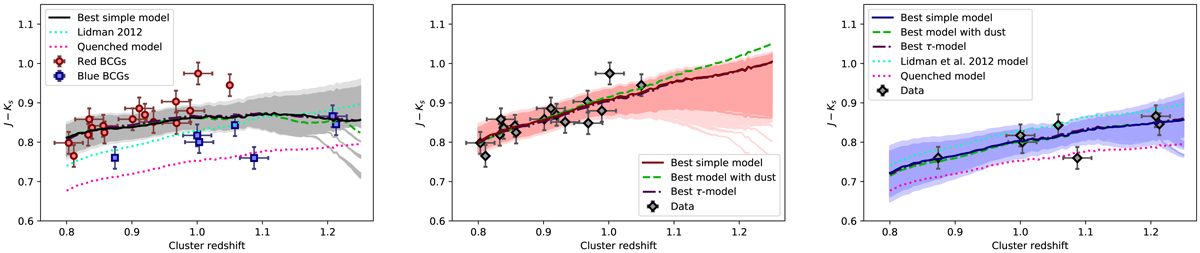
Best fits for different sub-samples. In each case, three fits were tested: a simple model, in which the metallicity and the formation redshift, assuming an instantaneous starburst, were allowed to vary; and two other models where an additional parameter was allowed to vary, which is the dust content in one case (green dashed line) or the characteristic timescale of the star formation, assuming an exponentially decreasing star formation rate, instead of an instantaneous starburst (purple dash-dotted line). For comparative purposes, we also display the best fit model of Lidman et al. (2012) and our red sequence fit on two panels (the dotted cyan and dotted magenta lines, respectively; see Sect. 4.1). The shaded region corresponds to the 95% confidence region for the simplest model tested and the darker zone corresponds to the 68% confidence region. Left panel: best fits for all BCGs at 0.8 ≤ z ≤ 1.2, except candidate 10 and three BCGs with known photometric problems. Red galaxies are a part of the red sample and blue galaxies are a part of the blue sample. Middle panel: best fits for the red BCGs sub-sample. Right panel: best fits for the blue sub-sample.
Current usage metrics show cumulative count of Article Views (full-text article views including HTML views, PDF and ePub downloads, according to the available data) and Abstracts Views on Vision4Press platform.
Data correspond to usage on the plateform after 2015. The current usage metrics is available 48-96 hours after online publication and is updated daily on week days.
Initial download of the metrics may take a while.