Fig. 8.
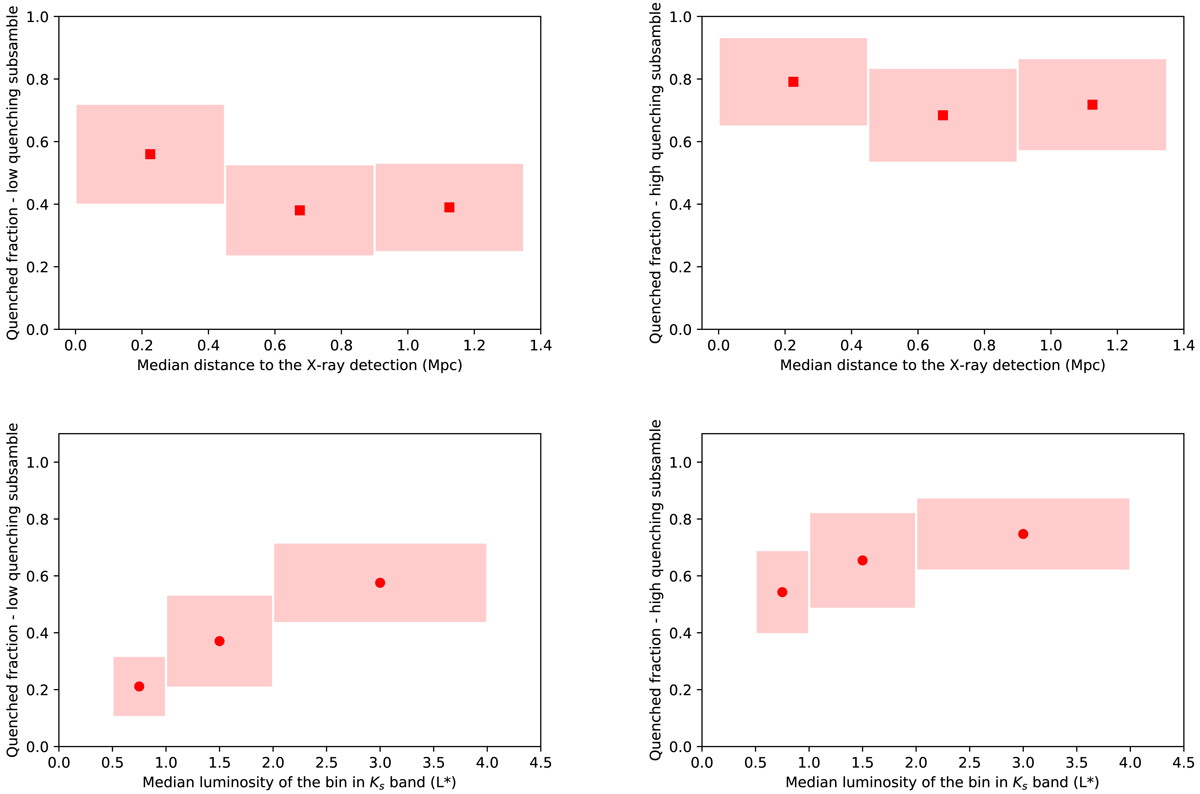
Top row: mean quenched fraction for each distance bin, for the low quenching (left) and high quenching (right) candidate clusters. Symbols mark the mean quenched fraction, while the shaded regions represent the bin size (x axis) and the standard deviation (y axis) of the quenched fraction. Bottom row: mean quenched fraction for each luminosity bin according to method 2/4 (method 2 is equivalent to method 4 in this context). Luminosities are expressed in terms of L*. We stress that L*, the absolute magnitude, changes with the redshift to reflect the passive evolution of a quenched galaxy. In the interval 0.8 ≤ z < 1.4, the absolute magnitude M* varies from −22.87 to −23.14 in the Ks band and the corresponding stellar masses from 1.45 × 10¹¹ M⊙ to 1.47 × 10¹¹ M⊙. Again, clusters are divided into low quenching (left) and a high quenching (right) groups. These plots only include clusters below z = 1.4 in order to mitigate the selection effects of the catalogue 5σ limit.
Current usage metrics show cumulative count of Article Views (full-text article views including HTML views, PDF and ePub downloads, according to the available data) and Abstracts Views on Vision4Press platform.
Data correspond to usage on the plateform after 2015. The current usage metrics is available 48-96 hours after online publication and is updated daily on week days.
Initial download of the metrics may take a while.