Fig. 6.
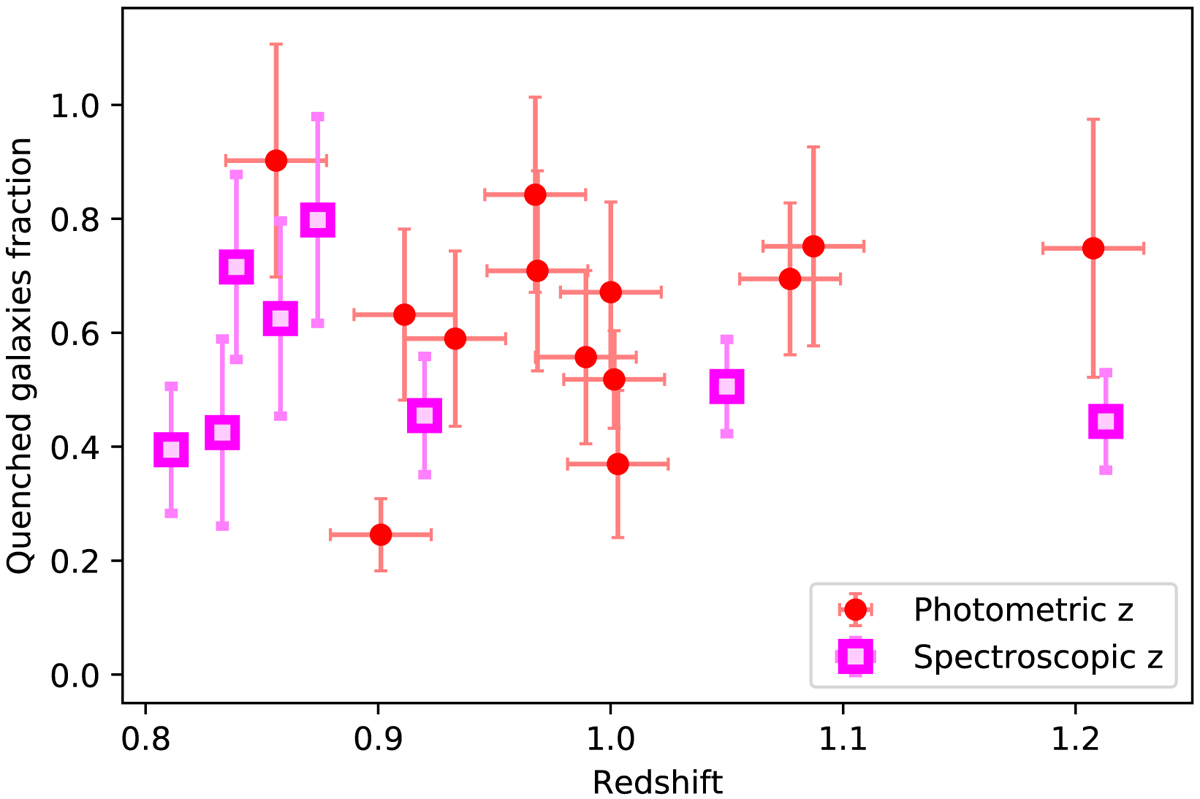
Fraction of quenched galaxies as a function of the redshift, according to method 4, for each VIDEO candidate, excluding candidates 1, 4, 10, 21, and 24 and the candidate clusters above z = 1.4. Spectroscopically confirmed clusters are indicated by squares, and circles are used to show the other ones. The error bars are the propagation on the Poissonian uncertainties on the integrals of the red sequence and the blue cloud models.
Current usage metrics show cumulative count of Article Views (full-text article views including HTML views, PDF and ePub downloads, according to the available data) and Abstracts Views on Vision4Press platform.
Data correspond to usage on the plateform after 2015. The current usage metrics is available 48-96 hours after online publication and is updated daily on week days.
Initial download of the metrics may take a while.