Fig. 5.
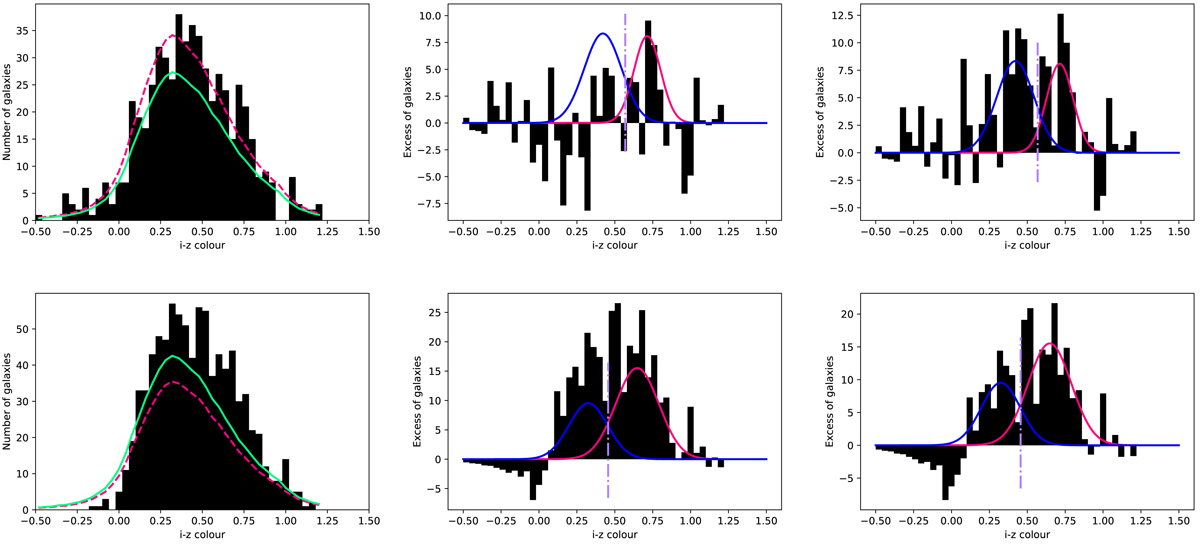
Illustration of two steps of the first method. Left panels: i − z colour histograms in two fields-of-view (candidate 13 and candidate 8) where the default background (pink line) is either too high or too low. The adjusted background is overplotted in green. Middle panels: resulting colour distribution is the background is left unadjusted. For comparison purposes, the Gaussian models of the red sequence and the blue cloud are shown in pink and blue, respectively; although, they were computed with an adjusted background. The mauve dash-dotted line is the “boundary” used in method 2, 3, and 4. Right panels: colour distribution once the background was adjusted.
Current usage metrics show cumulative count of Article Views (full-text article views including HTML views, PDF and ePub downloads, according to the available data) and Abstracts Views on Vision4Press platform.
Data correspond to usage on the plateform after 2015. The current usage metrics is available 48-96 hours after online publication and is updated daily on week days.
Initial download of the metrics may take a while.