Fig. 4.
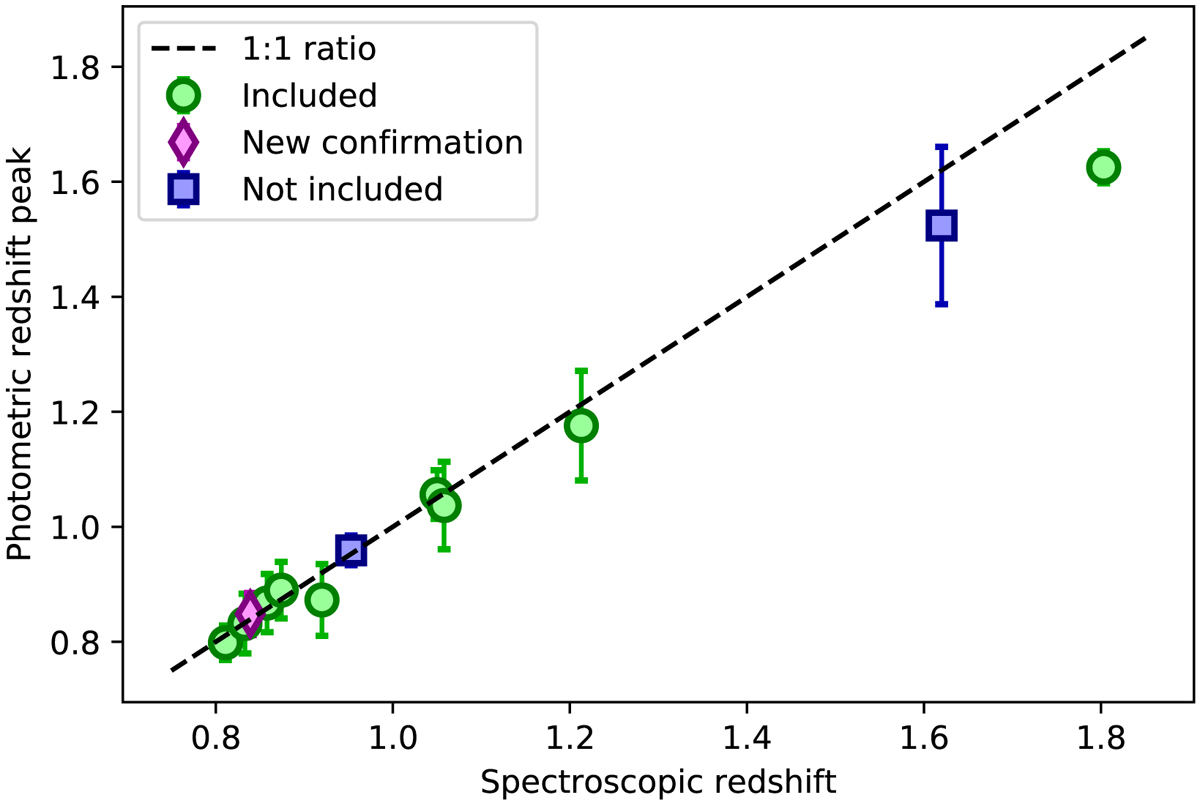
Comparison between the spectroscopic redshifts of confirmed clusters within the XXL-N/VIDEO overlap and the corresponding photometric overdensities in the VIDEO catalogue. The error bars correspond to the standard deviation of the Gaussian model that fits the photometric spike best. All clusters, except two (not included), were detected in optical. The green dots are the clusters that are a part of our sample, while the blue squares are not included in our sample since they do not meet our X-ray selection criteria. The magenta diamond is the newly confirmed candidate 3. The dashed line represents the ideal case, where zphot = zspec.
Current usage metrics show cumulative count of Article Views (full-text article views including HTML views, PDF and ePub downloads, according to the available data) and Abstracts Views on Vision4Press platform.
Data correspond to usage on the plateform after 2015. The current usage metrics is available 48-96 hours after online publication and is updated daily on week days.
Initial download of the metrics may take a while.