Fig. 2.
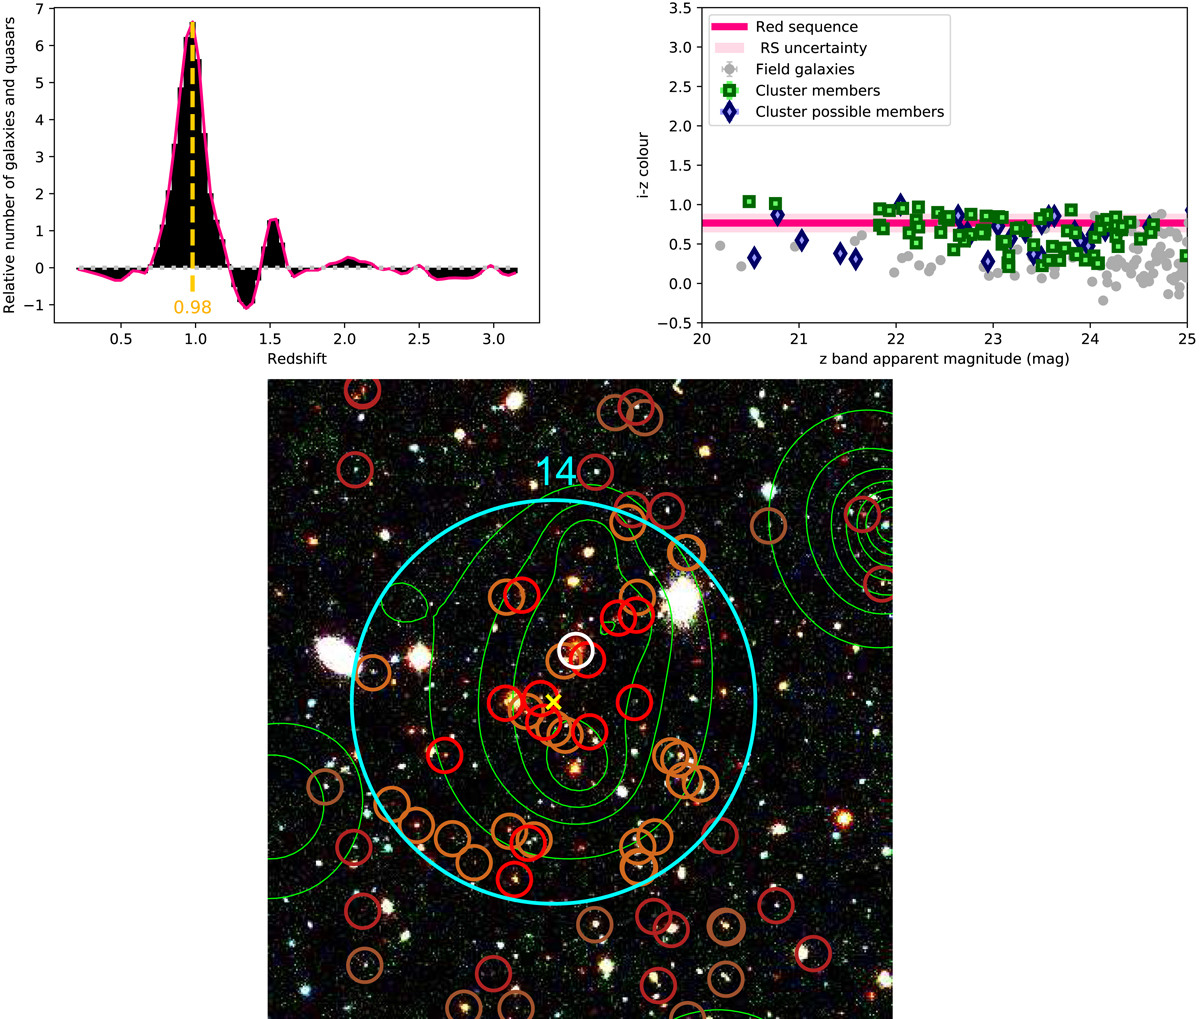
Visual summary of the cluster identification process. Top left: background subtracted and Gaussian filtered photometric redshift distribution of the bright galaxies within the central arcmin of candidate 14. The dashed line indicates the highest bin in the redshift spike. Top right: i − z CMD plot of the galaxies above the VIDEO 5σ limit within 1 arcmin of the centre. The green squares indicate the galaxies with photometric redshifts that are consistent with the mean redshift plus or minus 1.5 times the standard deviation of the most accurate Gaussian modelling of the redshift spike. The blue lozenges indicate galaxies with redshifts that are consistent with the sidewings of the most accurate Gaussian model, up to three times the standard deviation. The deep pink line indicates where the red sequence should be at this redshift, based on the best fit calculated in Sect. 4.1. The light pink region indicates the uncertainty on this red-sequence model, which is also calculated in Sect. 4.1. Bottom panel: example of a Megacam r and i filter as well as a VIDEO H filter image for candidate 14, which is one of our candidate clusters. The cyan circle delimits the region within 1 arcmin of the X-ray best fit model centre, which is marked by a yellow cross. The red and brown circles highlight the bright galaxies with a redshift corresponding to the cluster photometric peak redshift ±0.02 and to the cluster redshift ±0.06, respectively. Darker circles indicate the galaxies outside the central region. The BCG is circled in white. The X-ray contours in green are logarithmically distributed in ten levels between the maximum and minimum emission observed in a 7 × 7 arcmin2 box around the X-ray source.
Current usage metrics show cumulative count of Article Views (full-text article views including HTML views, PDF and ePub downloads, according to the available data) and Abstracts Views on Vision4Press platform.
Data correspond to usage on the plateform after 2015. The current usage metrics is available 48-96 hours after online publication and is updated daily on week days.
Initial download of the metrics may take a while.