Fig. B.1.
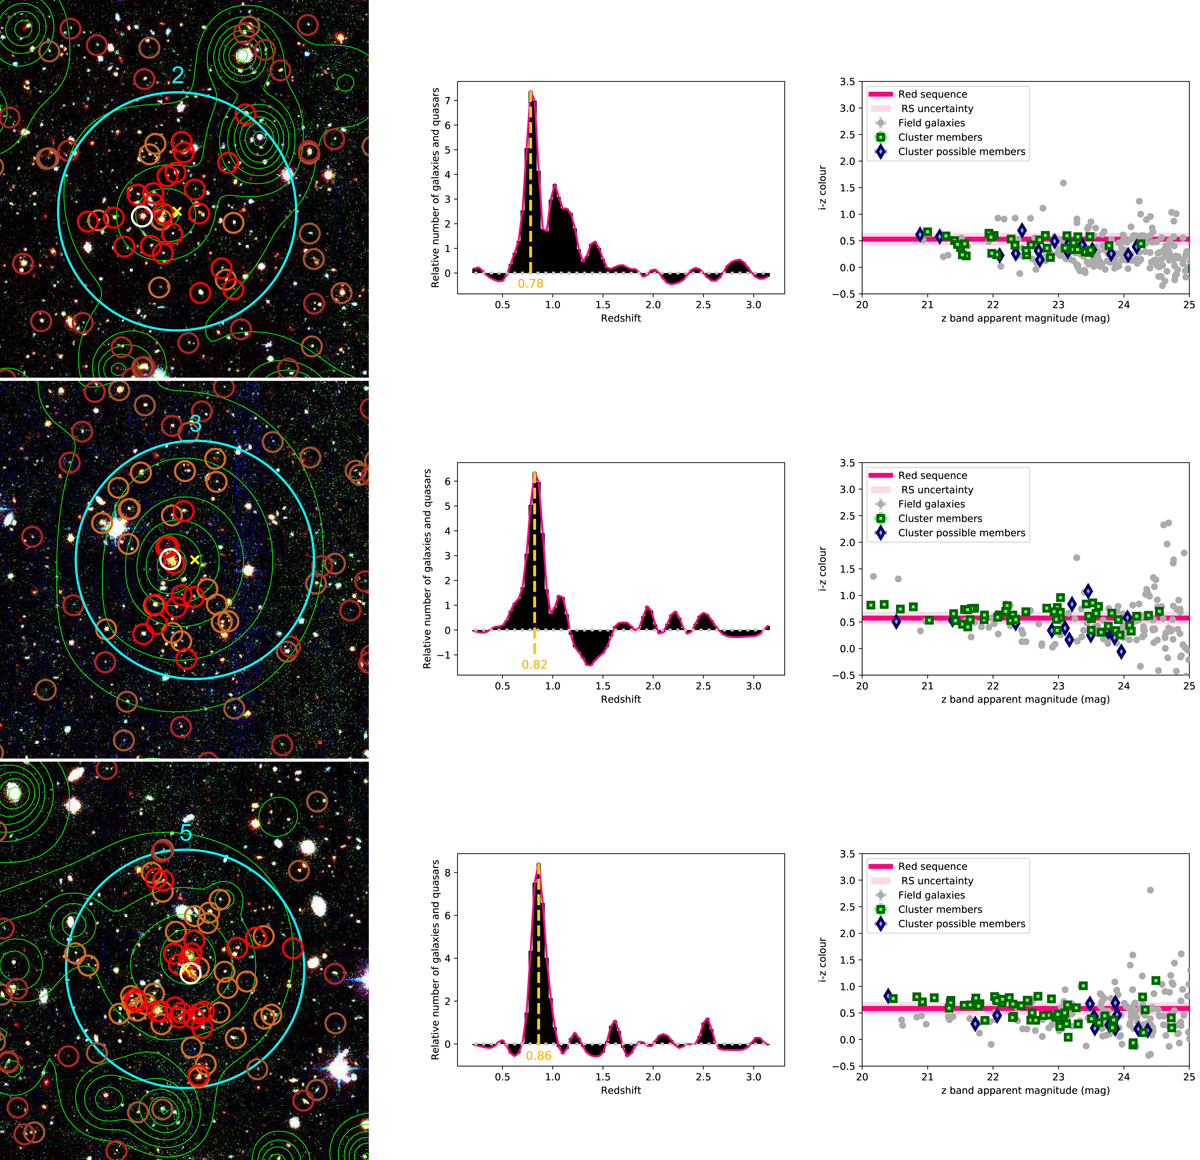
Left columns: Megacam R and I filter and VIDEO H filter images for each confirmed cluster at z ≥ 0.8 meeting our selection criteria, classified by increasing redshifts. The cyan circles delimit regions within 1 arcmin of the X-ray best fit model centres, which are marked by yellow crosses. The red and brown circles highlight the bright galaxies with a redshift corresponding to the cluster peak redshift ±0.02 and to the cluster redshift ±0.06, respectively. Darker circles indicate the galaxies outside of the central region. The BCGs are circled in white. The X-ray contours in green are logarithmically distributed in ten levels between the maximum and minimum emission observed in a 7 × 7 arcmin2 box around the X-ray source. Middle columns: background subtracted and Gaussian filtered redshift distribution of the bright galaxies within the central arcmin, for the corresponding candidates. The dashed line highlights the median redshift of the highest bin in the redshift spike. Its colour assesses the importance of the overdensity and, therefore, our confidence in the detection: gold for the most reliable candidates (the highest bin height is above 5.5), grey for the reliable one (above 4.5), and beige for the other. Right columns: i − z (0.8 ≤ z < 1.2) or z − J (z ≥ 1.2) CMD plot of the galaxies above the VIDEO 5σ limit within 1 arcmin of the centre. The green squares indicate the galaxies with photometric redshifts that are consistent with the mean redshift plus or minus 1.5 times the standard deviation of the most accurate Gaussian modelling of the redshift spike. The blue lozenges indicate the galaxies with redshifts that are consistent with the sidewings of the most accurate Gaussian model, so up to three times the standard deviation. The deep pink lines indicate the colours predicted by the stellar population model computed in Sect. 4.1. The light pink region is the standard deviation of the difference of this model with method 1 red sequences.
Current usage metrics show cumulative count of Article Views (full-text article views including HTML views, PDF and ePub downloads, according to the available data) and Abstracts Views on Vision4Press platform.
Data correspond to usage on the plateform after 2015. The current usage metrics is available 48-96 hours after online publication and is updated daily on week days.
Initial download of the metrics may take a while.