Fig. 11.
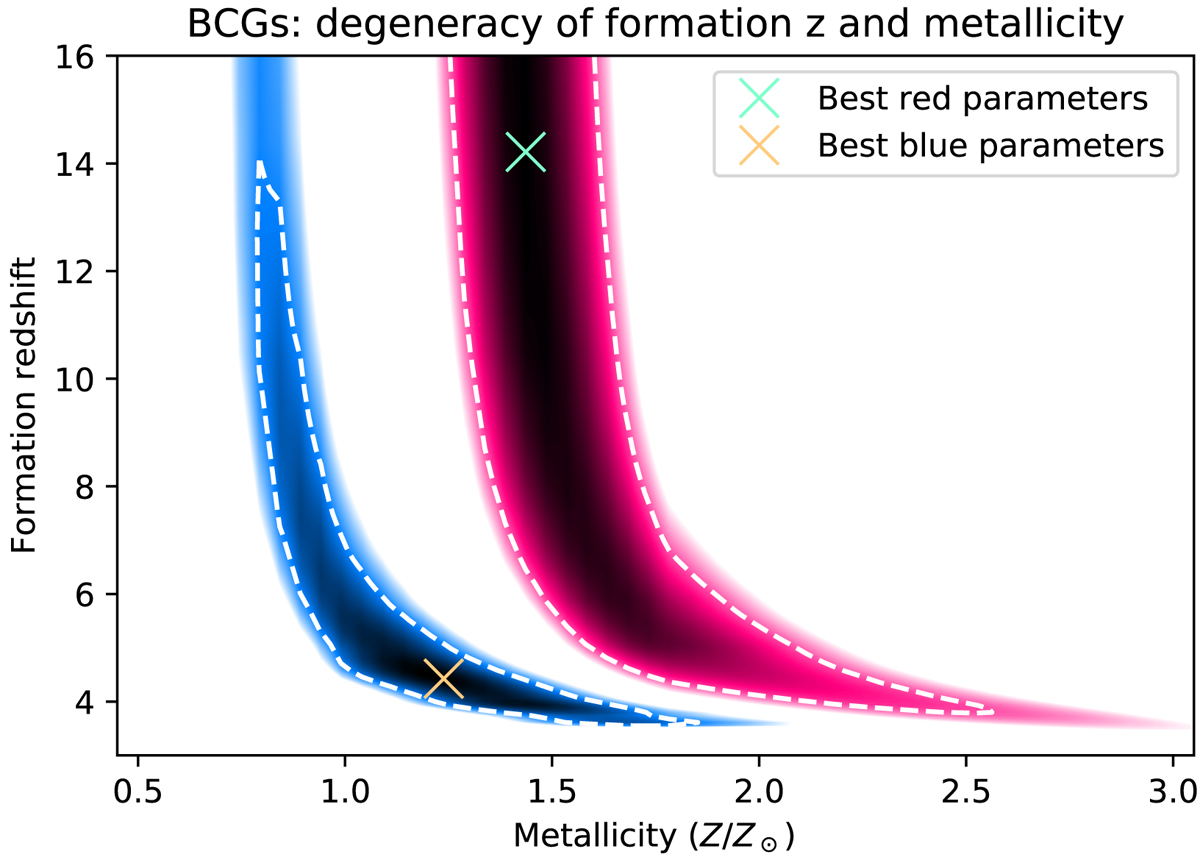
Contour plots for the red and blue BCG sub-samples showing the ![]() value as a function of the two varying parameters (formation redshift and metallicity). Dashed white curves correspond to the 68% confidence limit. The coloured regions correspond to the 95% confidence interval. The tested metallicity range is Z = 0.1 Z⊙ to Z = 5 Z⊙, but here it is restricted to Z = 0.5 Z⊙ to Z = 3.5 Z⊙. The tested formation redshift range is zform = 3 to zform = 16. The cross displays the location of the best fit parameters.
value as a function of the two varying parameters (formation redshift and metallicity). Dashed white curves correspond to the 68% confidence limit. The coloured regions correspond to the 95% confidence interval. The tested metallicity range is Z = 0.1 Z⊙ to Z = 5 Z⊙, but here it is restricted to Z = 0.5 Z⊙ to Z = 3.5 Z⊙. The tested formation redshift range is zform = 3 to zform = 16. The cross displays the location of the best fit parameters.
Current usage metrics show cumulative count of Article Views (full-text article views including HTML views, PDF and ePub downloads, according to the available data) and Abstracts Views on Vision4Press platform.
Data correspond to usage on the plateform after 2015. The current usage metrics is available 48-96 hours after online publication and is updated daily on week days.
Initial download of the metrics may take a while.