Fig. 9
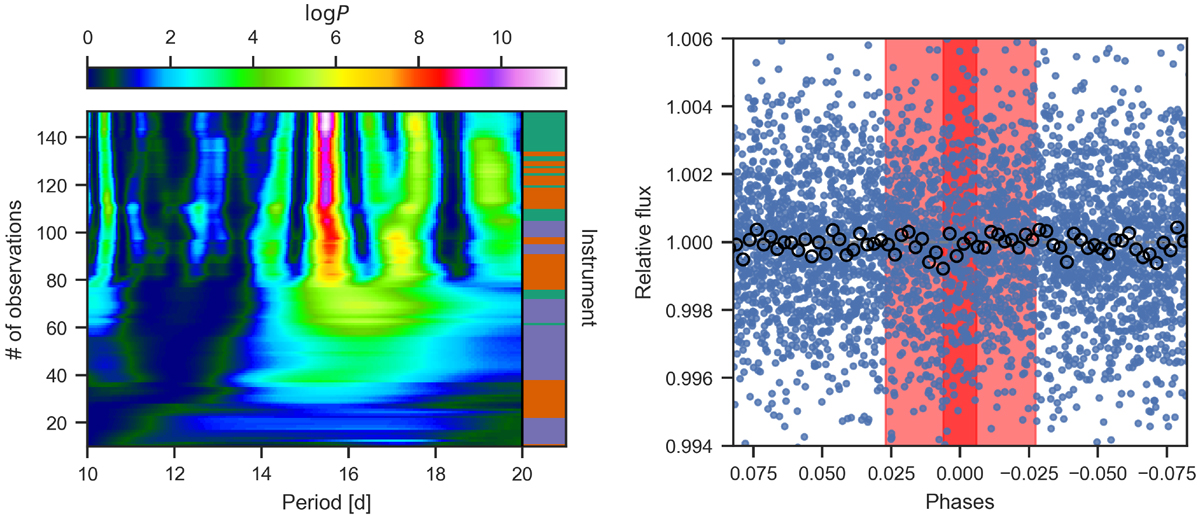
Investigation of the 15.5 d signal Left: stacked BGLS periodogram of the residuals after fitting for the transiting planet. The colourbar on the right side indicates the instrument of the corresponding data point (orange: CARMENES, purple: IRD, green: HARPS). Right: TESS light curve phase-folded to the period and time of transit centre of GJ 3473 c as determined from the RVs. The saturated red shaded region indicates the expected transit, while the light red shaded region denotes the 68% credibility interval of the time of transit centre.
Current usage metrics show cumulative count of Article Views (full-text article views including HTML views, PDF and ePub downloads, according to the available data) and Abstracts Views on Vision4Press platform.
Data correspond to usage on the plateform after 2015. The current usage metrics is available 48-96 hours after online publication and is updated daily on week days.
Initial download of the metrics may take a while.