Fig. 7
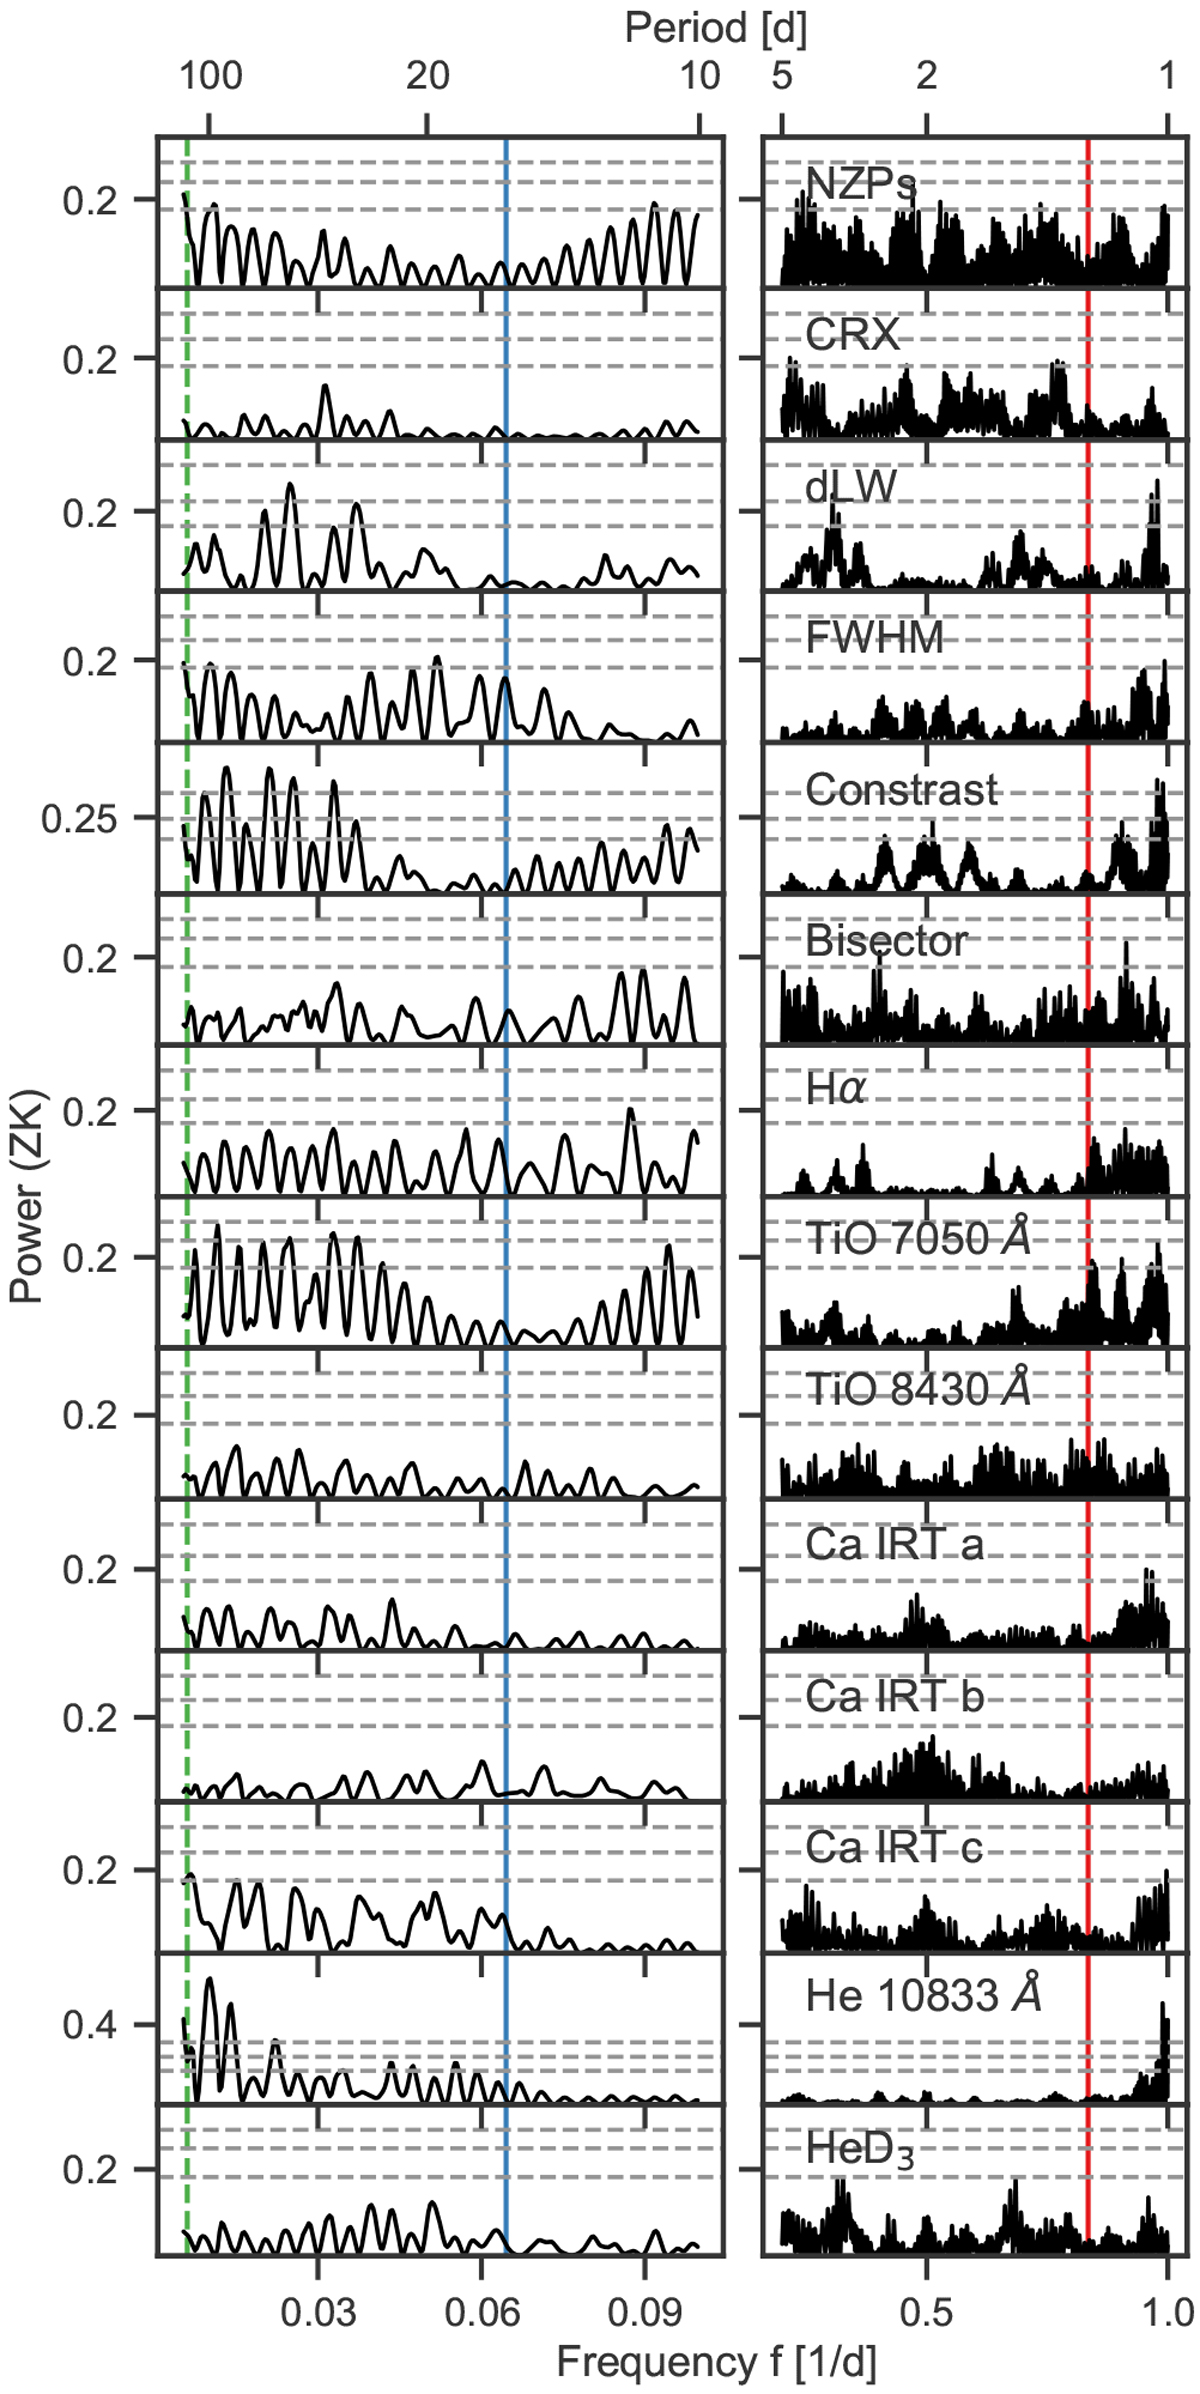
GLS periodograms of a number of activity indicators based on spectroscopic data obtained by CARMENES, split into two frequency ranges. The vertical lines mark the frequencies of the transiting planet candidate (red solid), the 15.5 d periodicity visible in the RV (blue solid; see Sect. 4.4), and the determined photometric rotation period (dashed green; see Sect. 4.7). The horizontal grey lines show the false alarm probability (FAP) of 10, 1, and 0.1% determined from 10 000 random realisations of the measurements.
Current usage metrics show cumulative count of Article Views (full-text article views including HTML views, PDF and ePub downloads, according to the available data) and Abstracts Views on Vision4Press platform.
Data correspond to usage on the plateform after 2015. The current usage metrics is available 48-96 hours after online publication and is updated daily on week days.
Initial download of the metrics may take a while.