Fig. 6
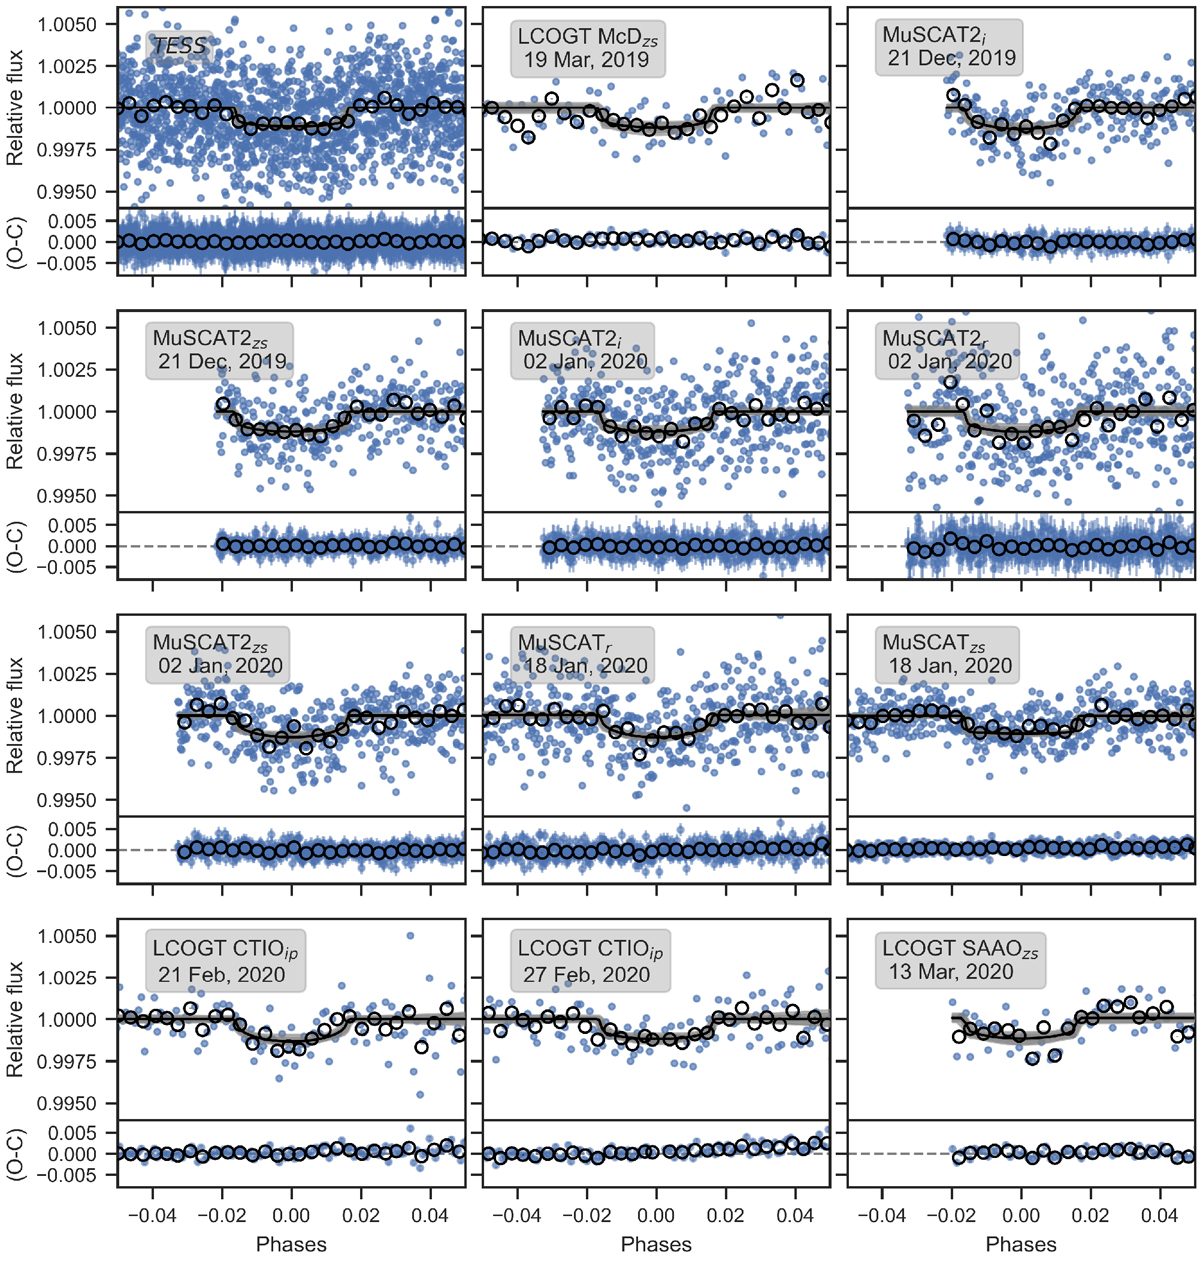
Results from the joint fit for the transit observations. In the top part of each panel, the black curve presents the best-fit juliet model together with the 68, 95, and 99% credibility intervals displayed by the grey shaded regions. The observations of the respective instruments are phase-folded to the period of the transiting planet. For the fit, the individual data points (blue) are used, but the binned data are also shown for clarity (white circles). Error bars of the individual measurements with the instrumental jitter terms added in quadrature are only displayed in the bottom part of the panels, which show the residuals after subtracting the model (O–C). The names of the instruments and the dates of the observations are denoted in the grey boxes in the upper left corner of each panel.
Current usage metrics show cumulative count of Article Views (full-text article views including HTML views, PDF and ePub downloads, according to the available data) and Abstracts Views on Vision4Press platform.
Data correspond to usage on the plateform after 2015. The current usage metrics is available 48-96 hours after online publication and is updated daily on week days.
Initial download of the metrics may take a while.