Fig. 5
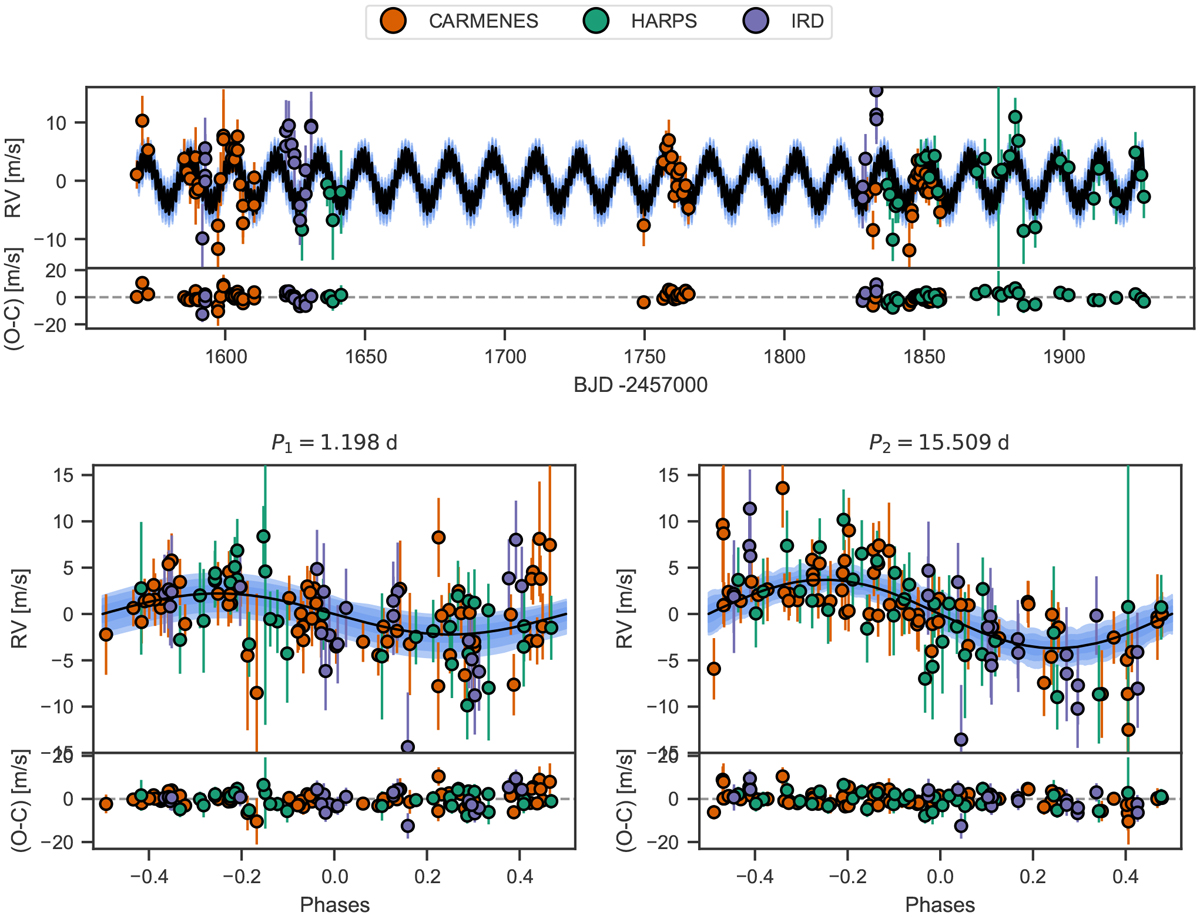
Results from the joint fit for the RV data of CARMENES, IRD, and HARPS. The top part of each panel shows the measurements as coloured circles – errorbars include the instrumental jitters added in quadrature – and the median of the best-fit juliet model as the black curve. The grey shaded areas mark the 68, 95, and 99% credibility intervals. To avoid overcrowding of the figure, we binned the IRD data, which were taken with a high cadence, to chunks of 30 min each. In the lower part, the residuals after the model is subtracted (O-C) are shown. Top panel: RVs over time. Bottom panels: RVs phase-folded to the periods of the transiting planet (left) and the new RV planet (right).
Current usage metrics show cumulative count of Article Views (full-text article views including HTML views, PDF and ePub downloads, according to the available data) and Abstracts Views on Vision4Press platform.
Data correspond to usage on the plateform after 2015. The current usage metrics is available 48-96 hours after online publication and is updated daily on week days.
Initial download of the metrics may take a while.