Free Access
Fig. 3
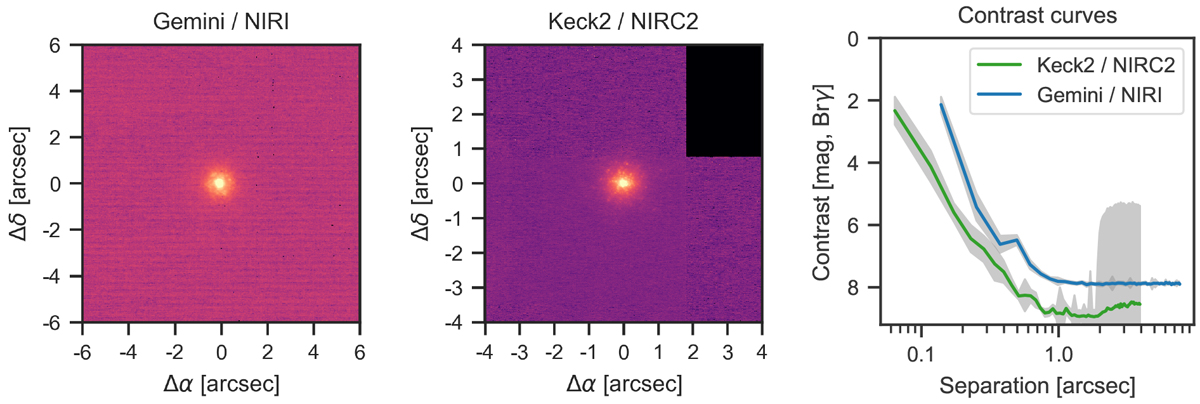
AO images and contrast curves of the Keck II and Gemini North observations of GJ 3473. The grey shaded regions in the contrast curves are the uncertainty, which apparently rises dramatically for NIRC2 because of a dead quadrant.
Current usage metrics show cumulative count of Article Views (full-text article views including HTML views, PDF and ePub downloads, according to the available data) and Abstracts Views on Vision4Press platform.
Data correspond to usage on the plateform after 2015. The current usage metrics is available 48-96 hours after online publication and is updated daily on week days.
Initial download of the metrics may take a while.