Fig. 7
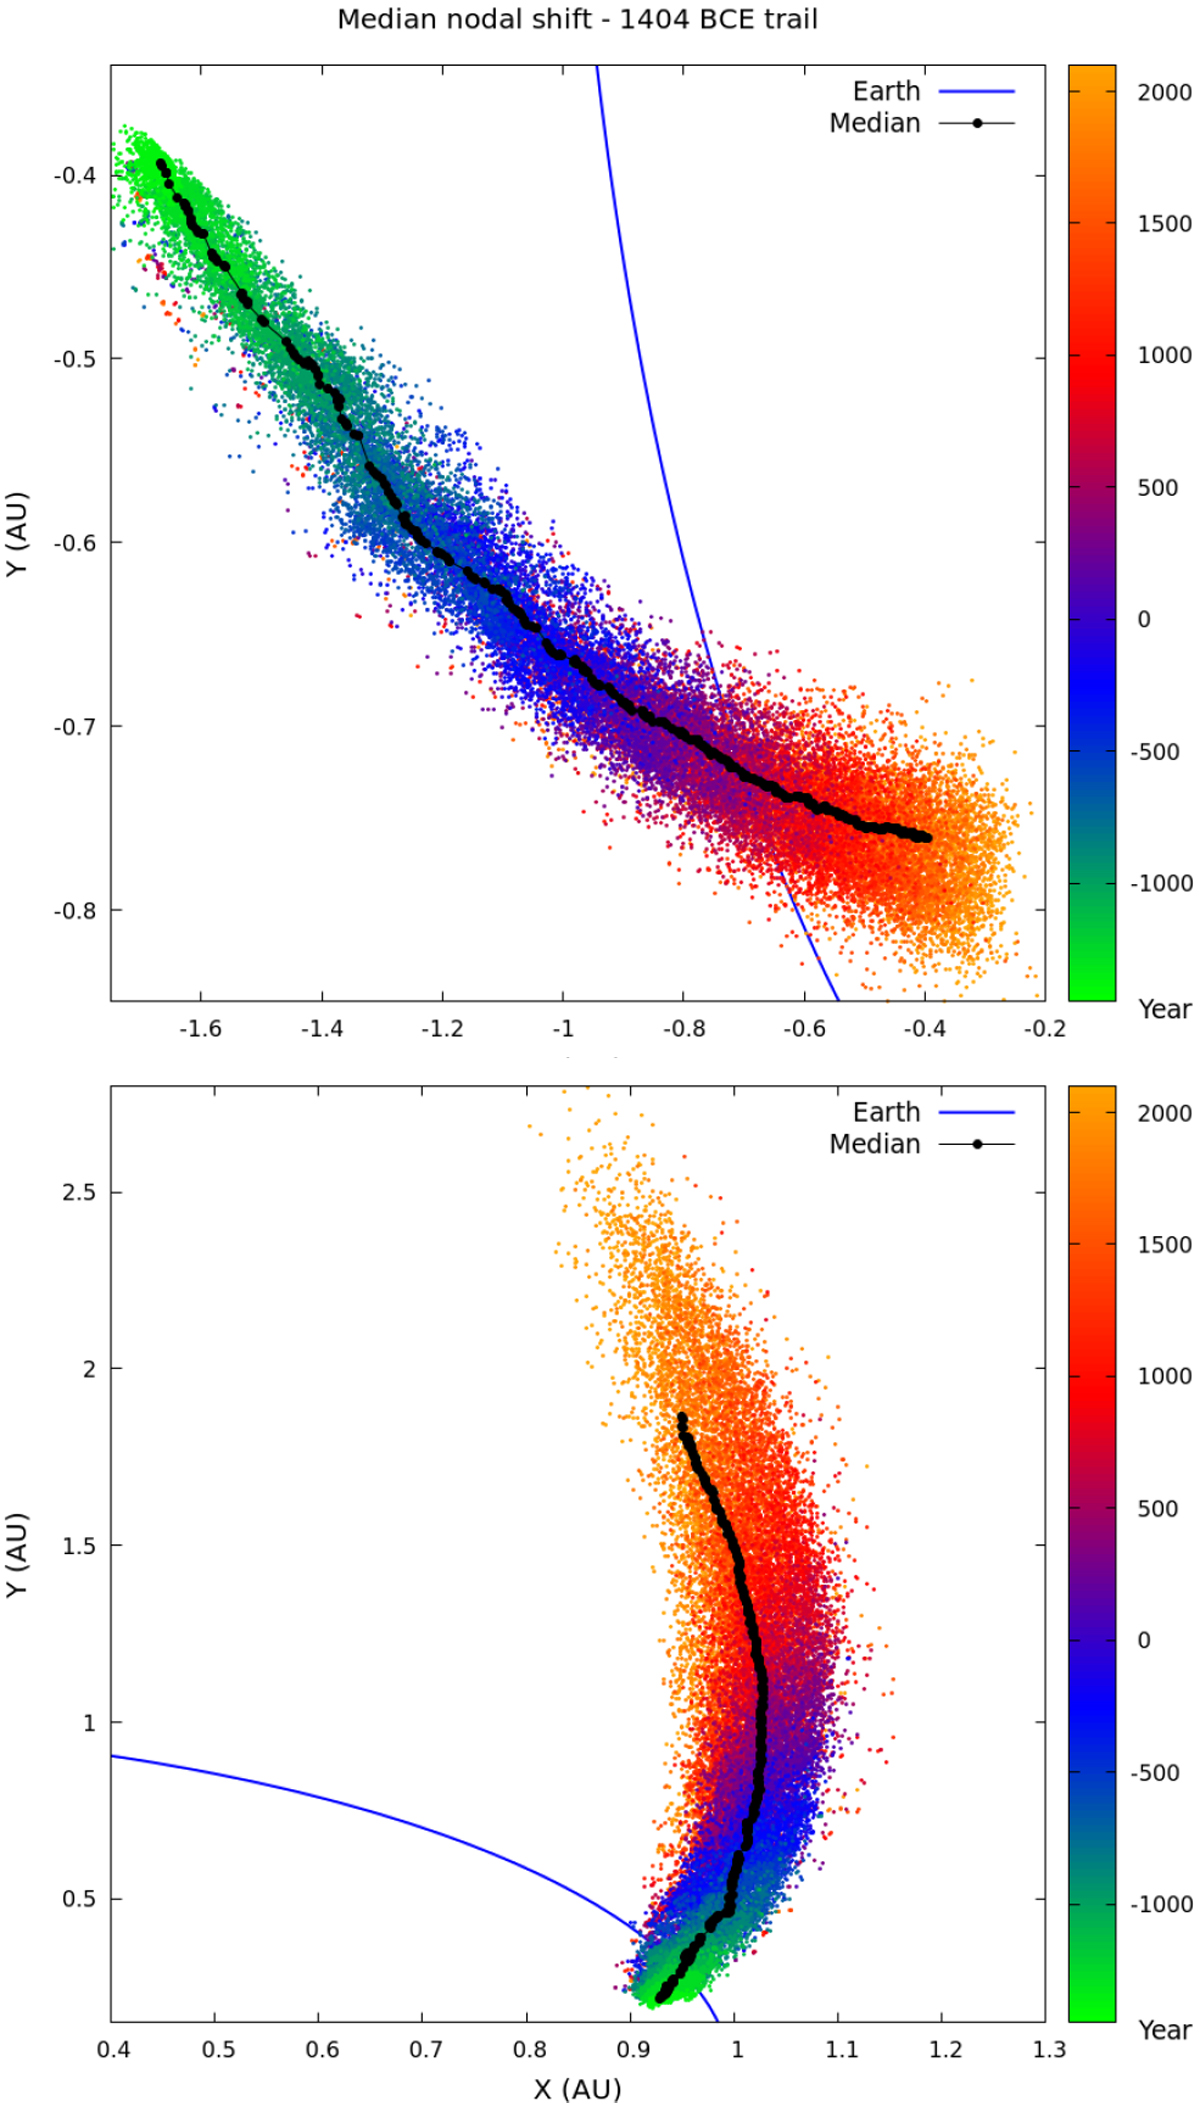
Evolution as a function of time (color coded as a function of the epoch) of the descending nodal footprint representing the η Aquariids (top) and ascending nodal footprint representing the Orionids (bottom) of a simulated trail ejected in 1404 BCE. The particle sizes are between 0.1 and 1 mm. The Earth’s orbit in 2020 CE, computed in the barycentric frame, is represented with a blue line.
Current usage metrics show cumulative count of Article Views (full-text article views including HTML views, PDF and ePub downloads, according to the available data) and Abstracts Views on Vision4Press platform.
Data correspond to usage on the plateform after 2015. The current usage metrics is available 48-96 hours after online publication and is updated daily on week days.
Initial download of the metrics may take a while.