Fig. 5
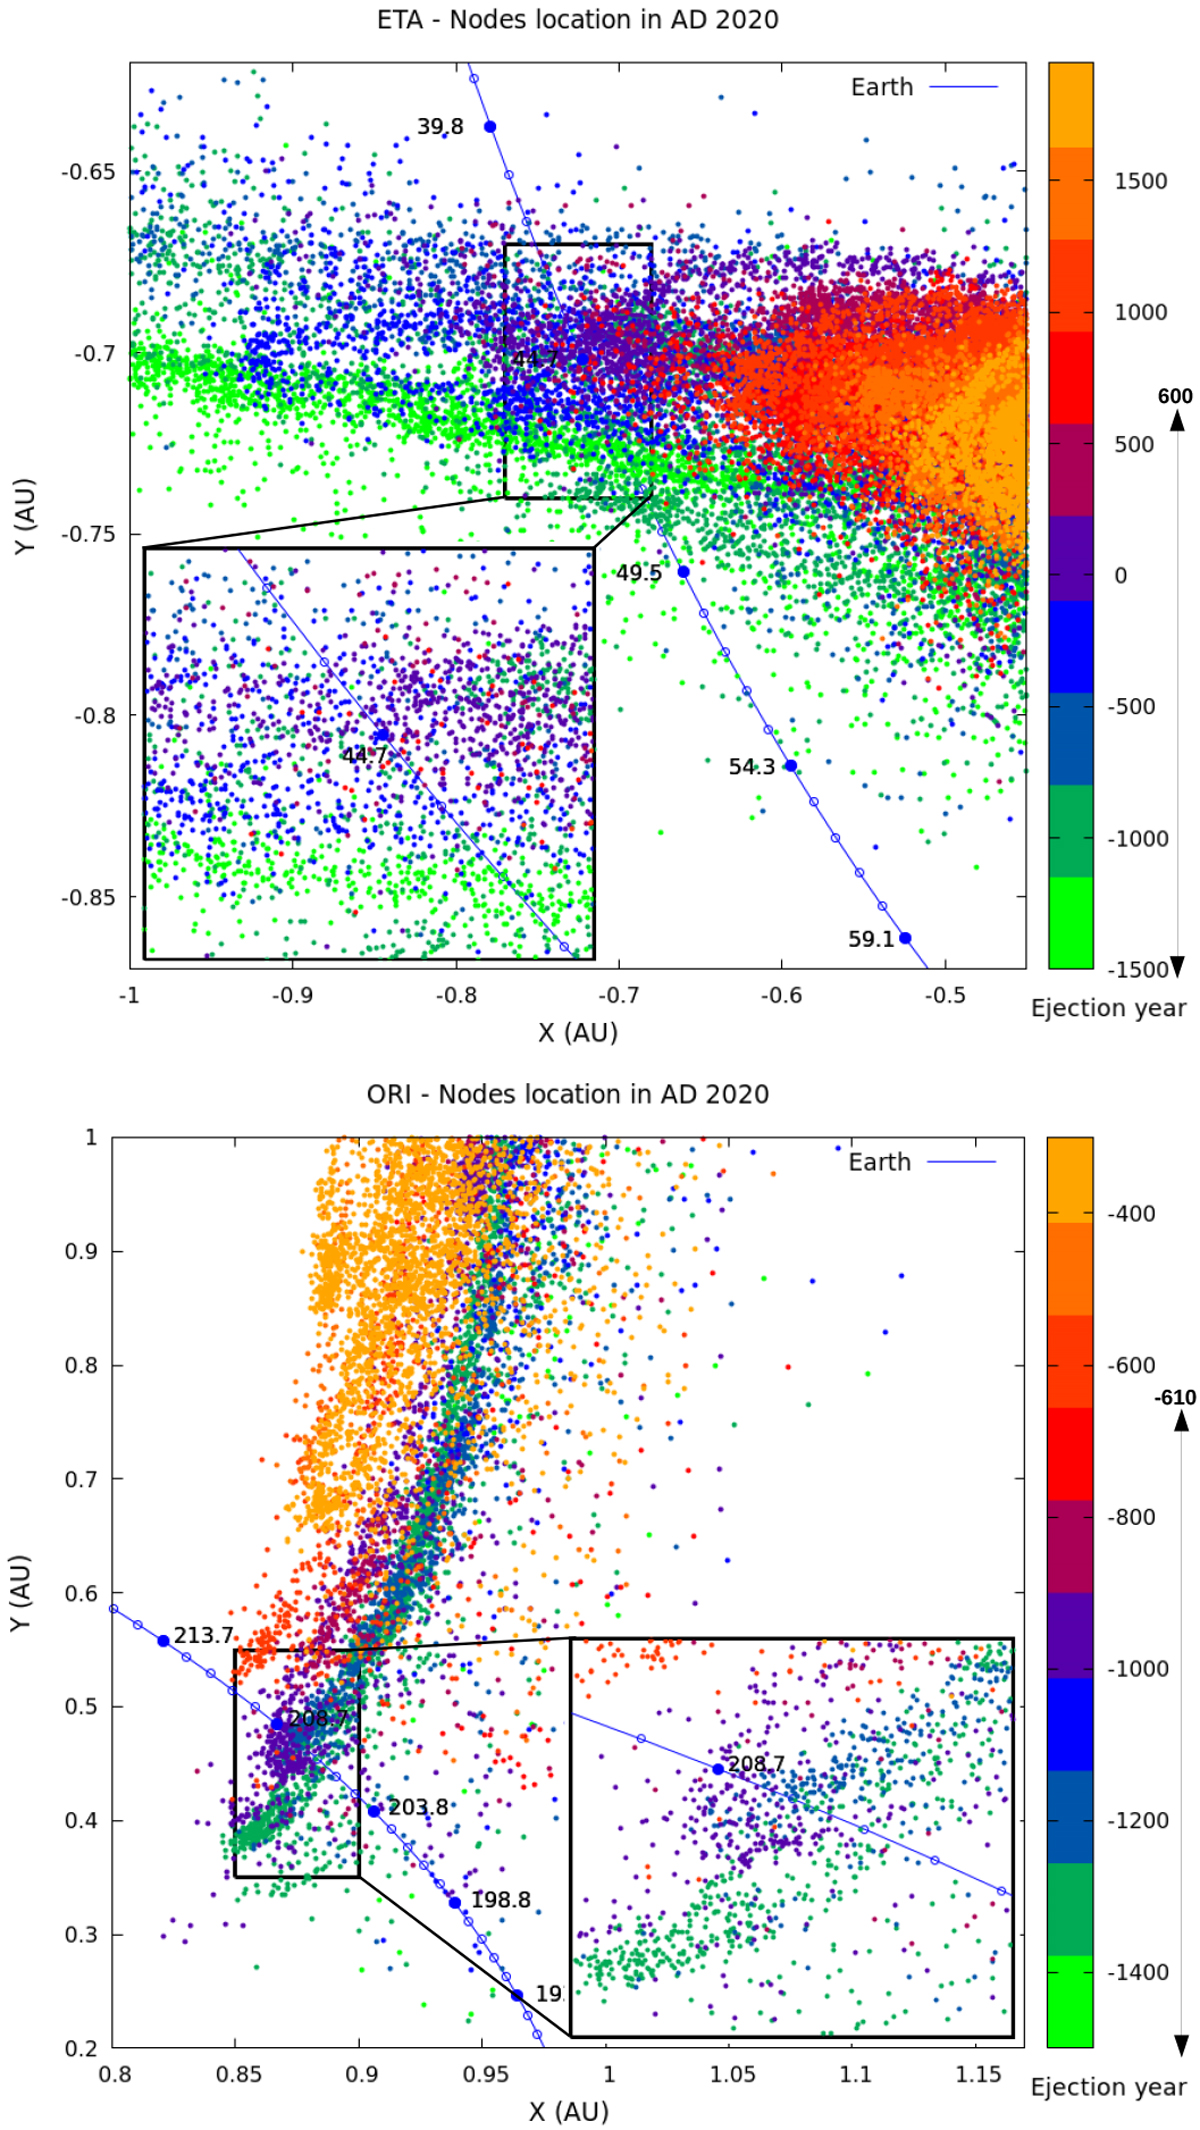
Node locations in 2020 CE for all particles as a function of their ejection date. The daily positions of the Earth on its orbit are indicated by blue circles. Numbers along the orbit correspond to the SL with a time step of 5 days. This distribution represents a crude estimate of the overall duration of the shower and peak activity location expected at the return in 2020 CE.
Current usage metrics show cumulative count of Article Views (full-text article views including HTML views, PDF and ePub downloads, according to the available data) and Abstracts Views on Vision4Press platform.
Data correspond to usage on the plateform after 2015. The current usage metrics is available 48-96 hours after online publication and is updated daily on week days.
Initial download of the metrics may take a while.