Fig. D.1
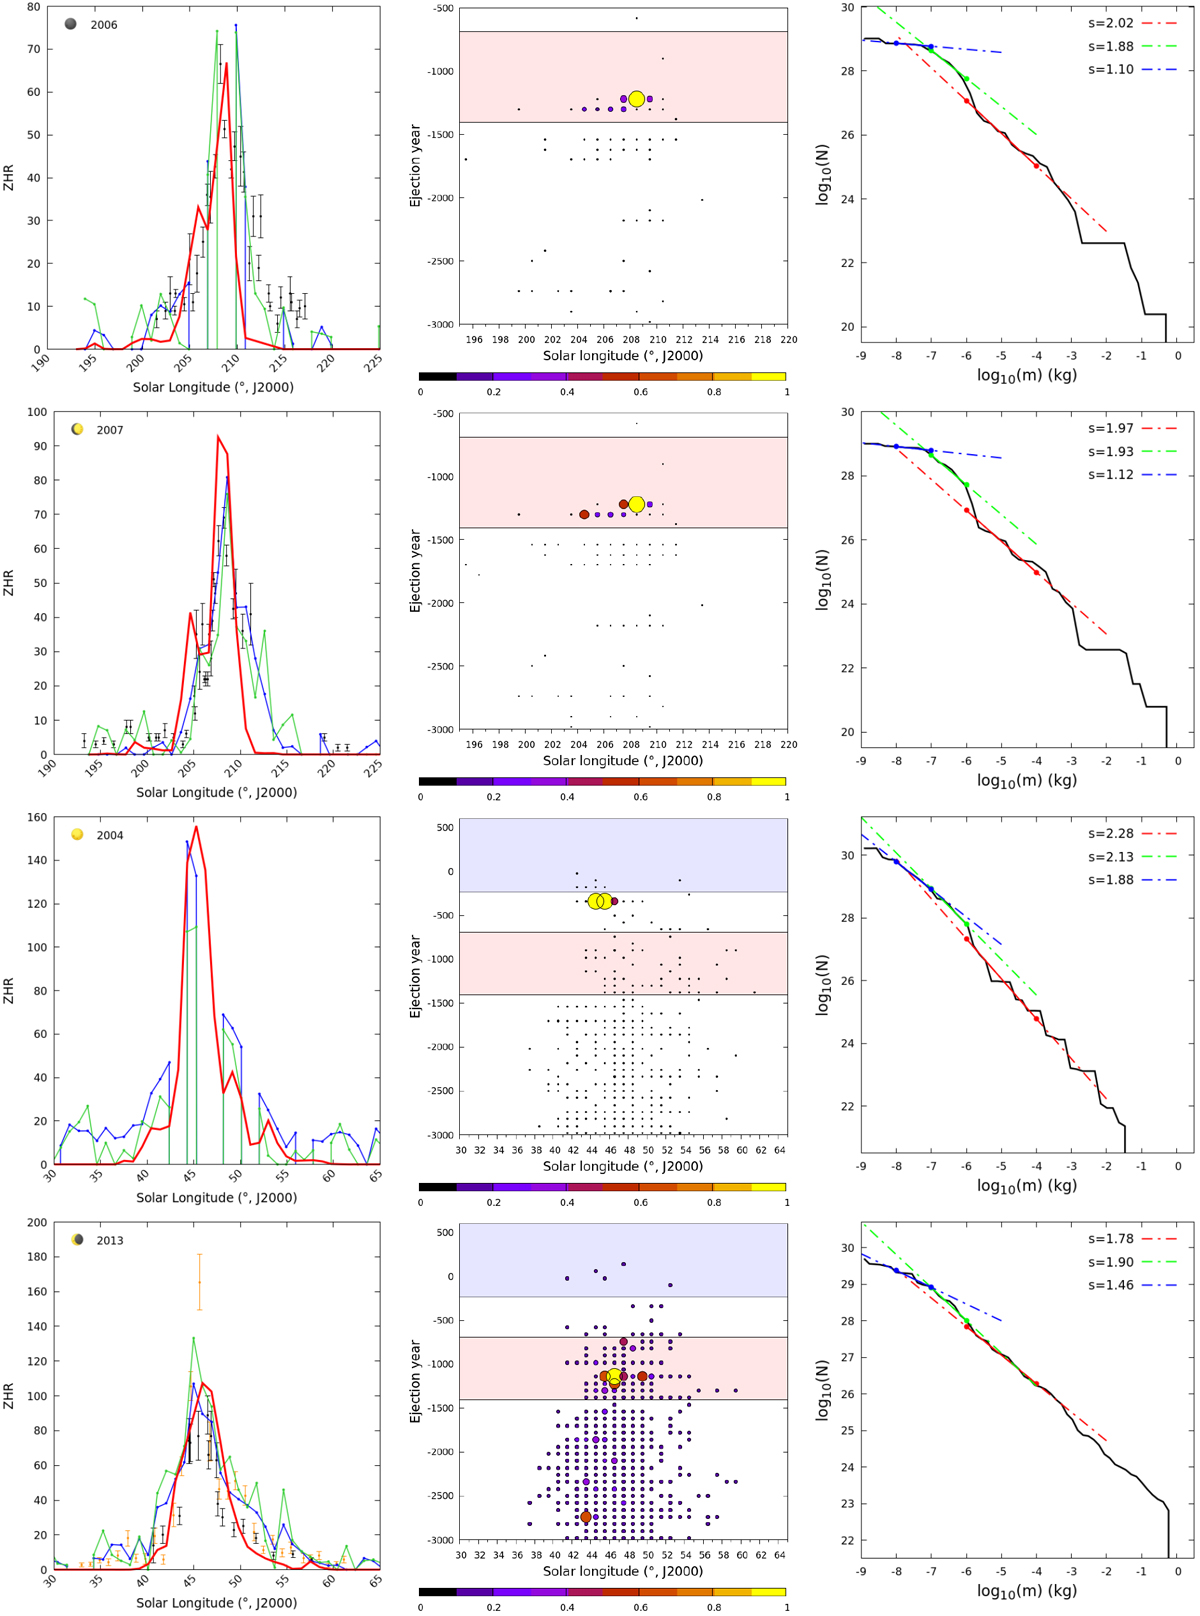
From left to right: simulated (red line) and measured ZHR profiles, relative contribution of simulated trails, and cumulative mass distribution. The trails’ relative contribution is indicated by the circles size (small to large) and color (black: low significance, to yellow: highest contribution). The red band in the middle panel indicates the times when 1P/Halley was in the 1:6 resonance and blue the 2:13, as discussed in Sect. 2.4.3.
Current usage metrics show cumulative count of Article Views (full-text article views including HTML views, PDF and ePub downloads, according to the available data) and Abstracts Views on Vision4Press platform.
Data correspond to usage on the plateform after 2015. The current usage metrics is available 48-96 hours after online publication and is updated daily on week days.
Initial download of the metrics may take a while.