Open Access
Fig. B.1
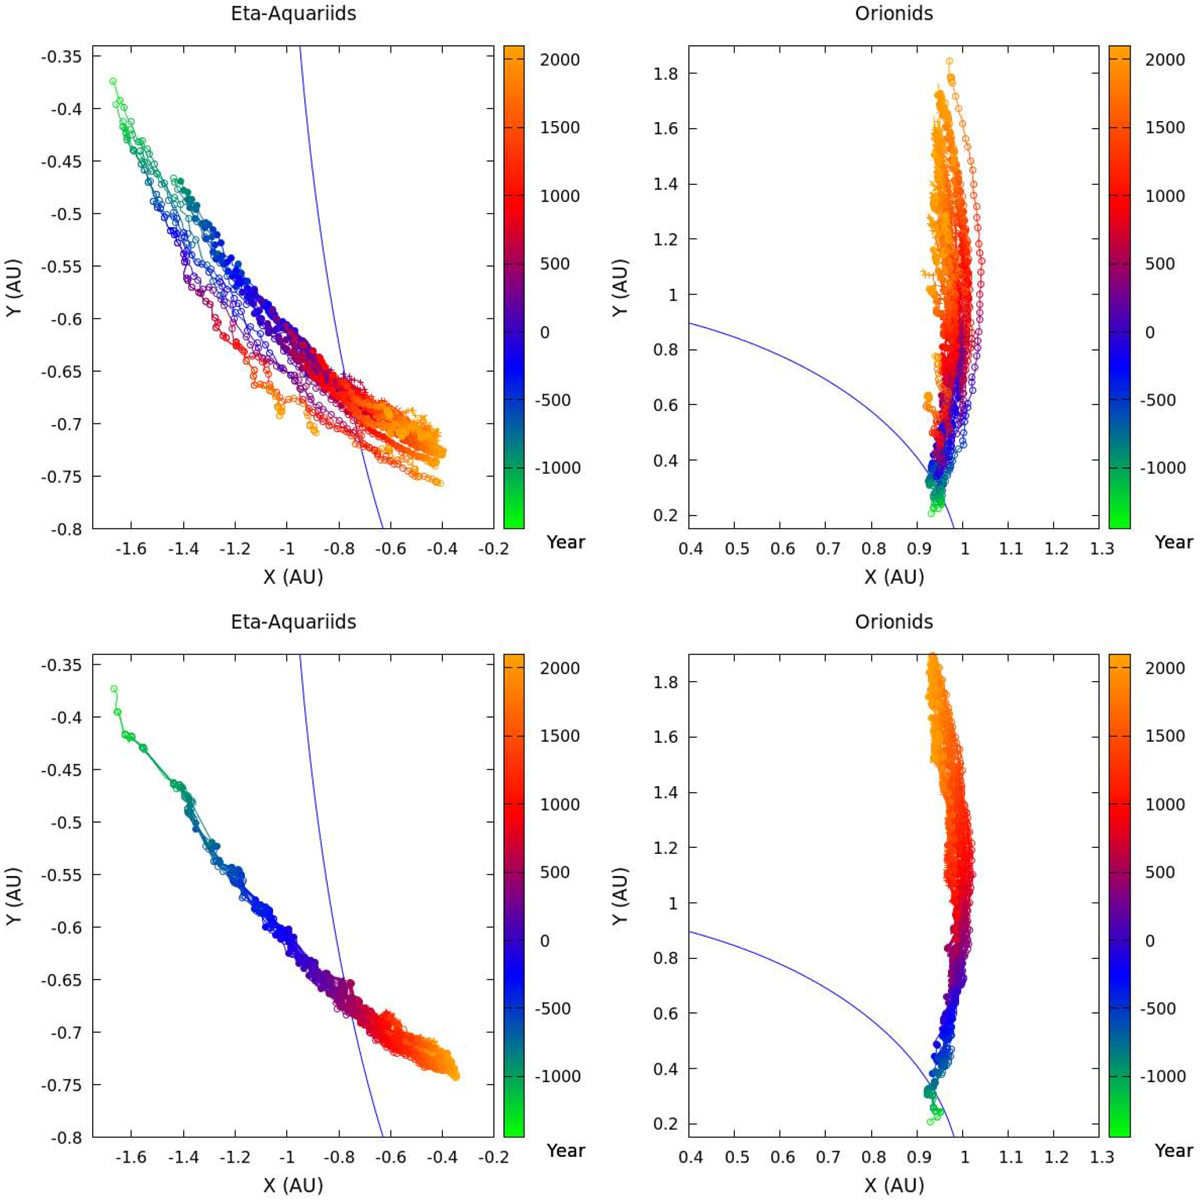
Median location of the trails’ descending node (left panels) and ascending node (right panels) as a function of time for particles of sizes 0.1–1mm (top panels) and 10–100 mm (bottom panels). Each line represents a meteoroid trail ejected during a single apparition of the comet, between 1404 BCE and 1910 CE.
Current usage metrics show cumulative count of Article Views (full-text article views including HTML views, PDF and ePub downloads, according to the available data) and Abstracts Views on Vision4Press platform.
Data correspond to usage on the plateform after 2015. The current usage metrics is available 48-96 hours after online publication and is updated daily on week days.
Initial download of the metrics may take a while.