Open Access
Fig. A.2
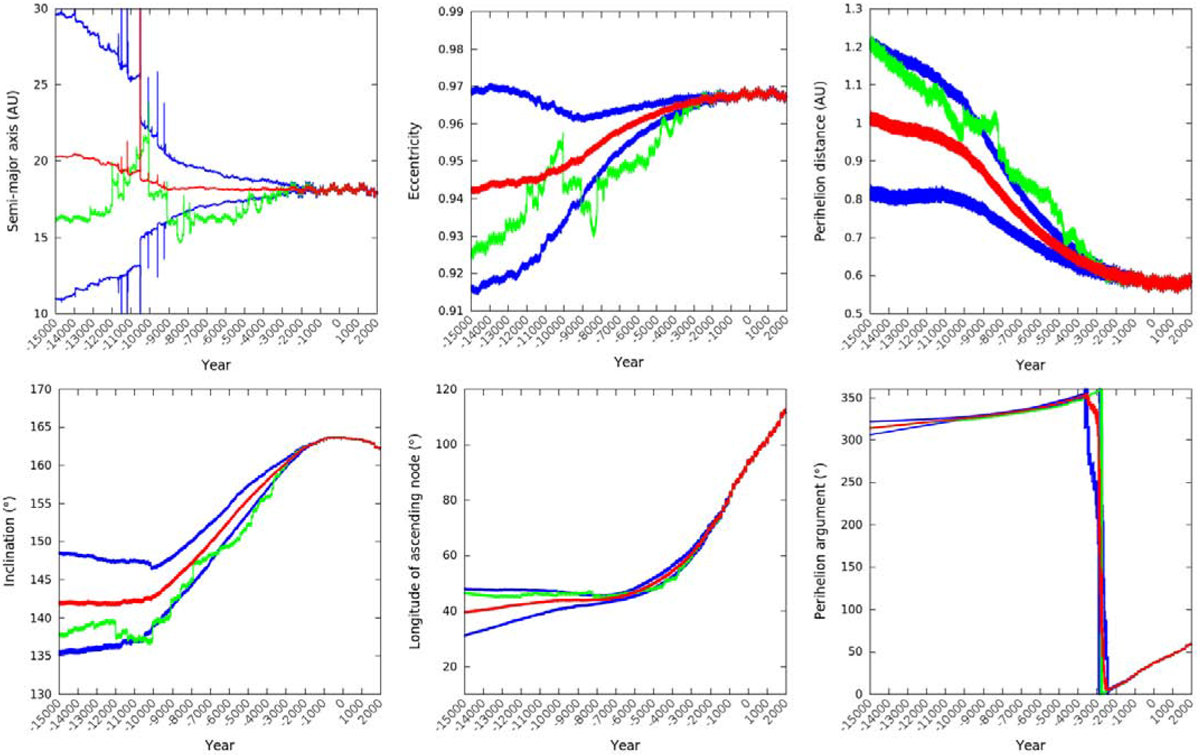
Time-evolution of the nominal (green) and average (red) orbital elements of 1000 clones of comet 1P/Halley generated in 1994 CE and based on the JPL J863/77 solution. The blue curves represent the one standard deviation range about the average semi-major axis.
Current usage metrics show cumulative count of Article Views (full-text article views including HTML views, PDF and ePub downloads, according to the available data) and Abstracts Views on Vision4Press platform.
Data correspond to usage on the plateform after 2015. The current usage metrics is available 48-96 hours after online publication and is updated daily on week days.
Initial download of the metrics may take a while.