Fig. 18
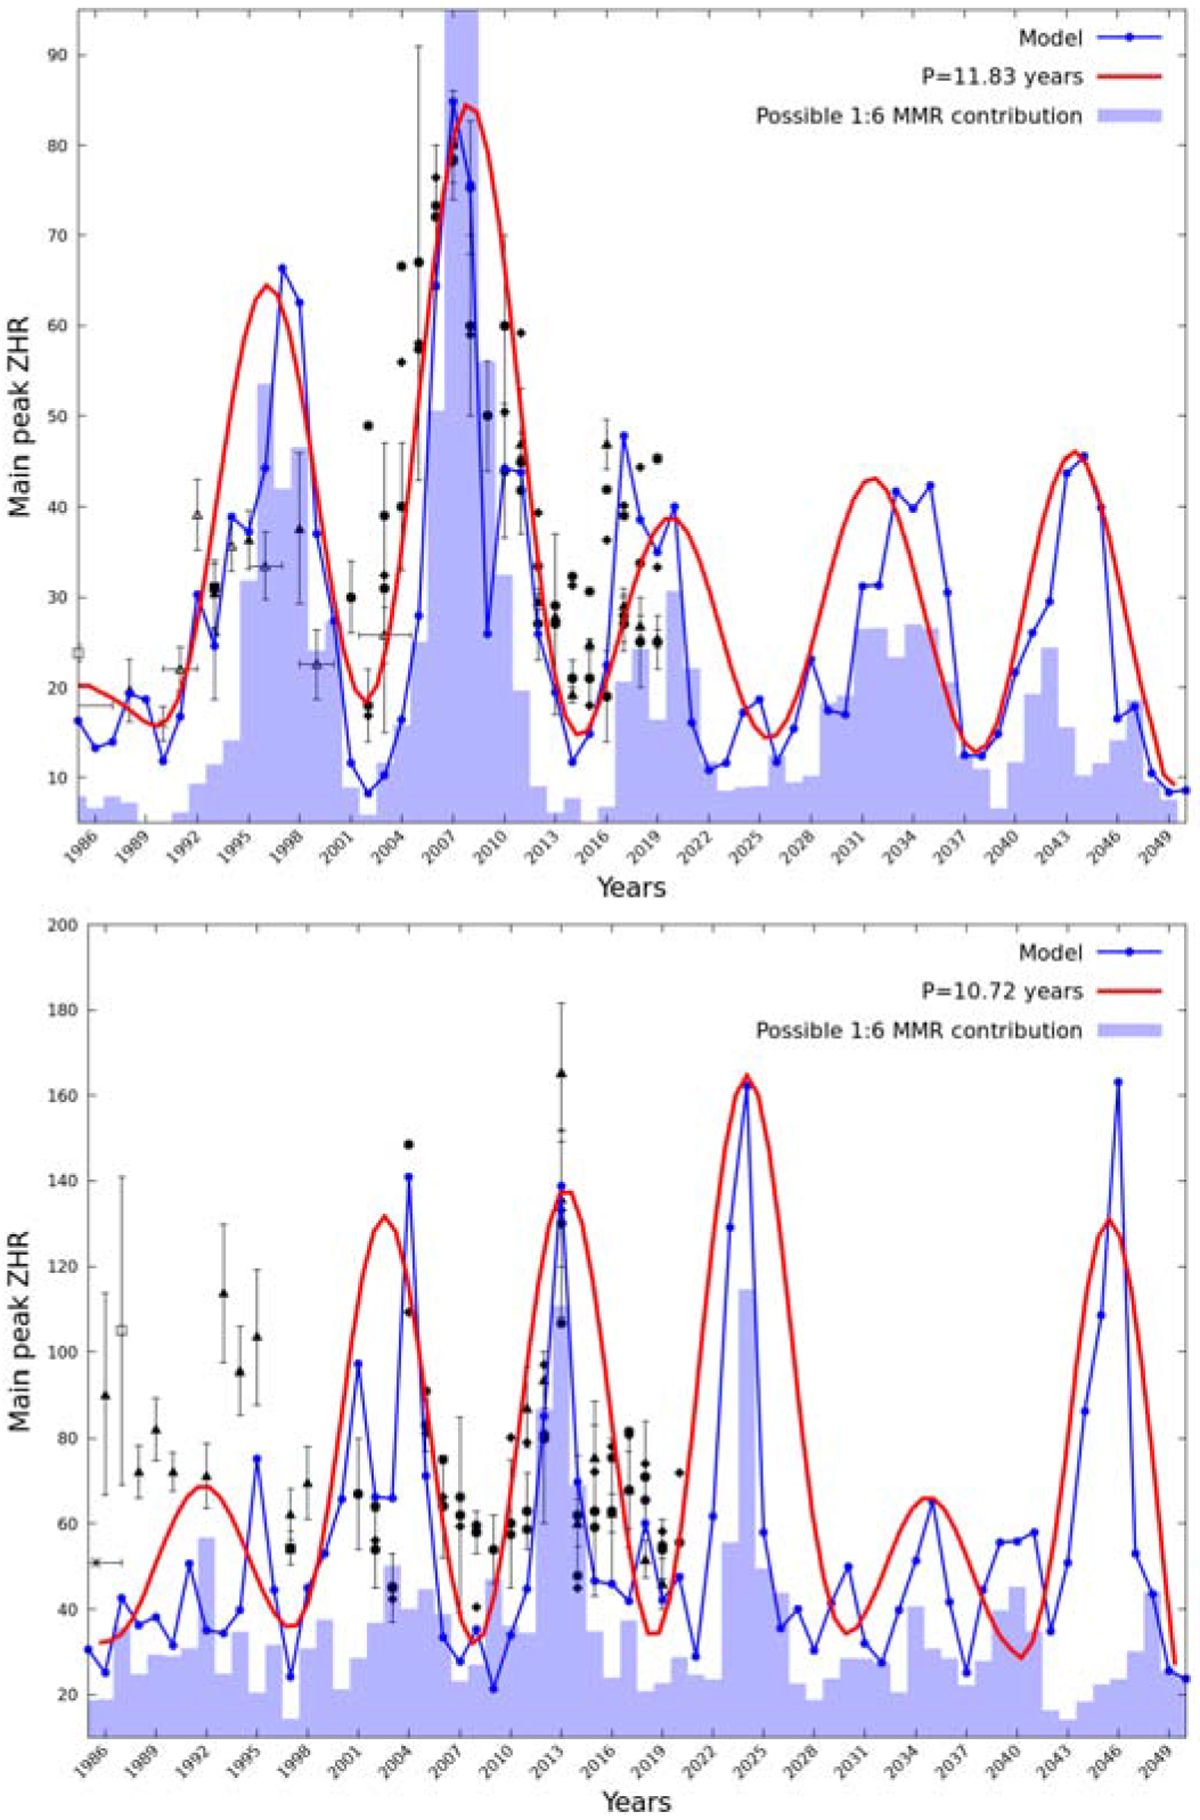
Annual variation of the observed (in black) and modeled (dark blue line) Orionid (top) and η-Aquariid (bottom) peak ZHRs between 1985 and 2050. This figure represents a combination of Figs. 14 and 16. A sinusoidal curve of variable amplitude was fit to the modeled and observed meteor rates. This fit result is presented in red in the figure. The best match with the model yields a period of 11.83 yr in the case of the Orionids and 10.72 yr for the η-Aquariids. The relativecontribution of particles intercepted by the Earth in a given year, which were ejected while 1P/Halley was trapped in the 1:6 MMR with Jupiter, are shown with blue boxes.
Current usage metrics show cumulative count of Article Views (full-text article views including HTML views, PDF and ePub downloads, according to the available data) and Abstracts Views on Vision4Press platform.
Data correspond to usage on the plateform after 2015. The current usage metrics is available 48-96 hours after online publication and is updated daily on week days.
Initial download of the metrics may take a while.