Fig. 17
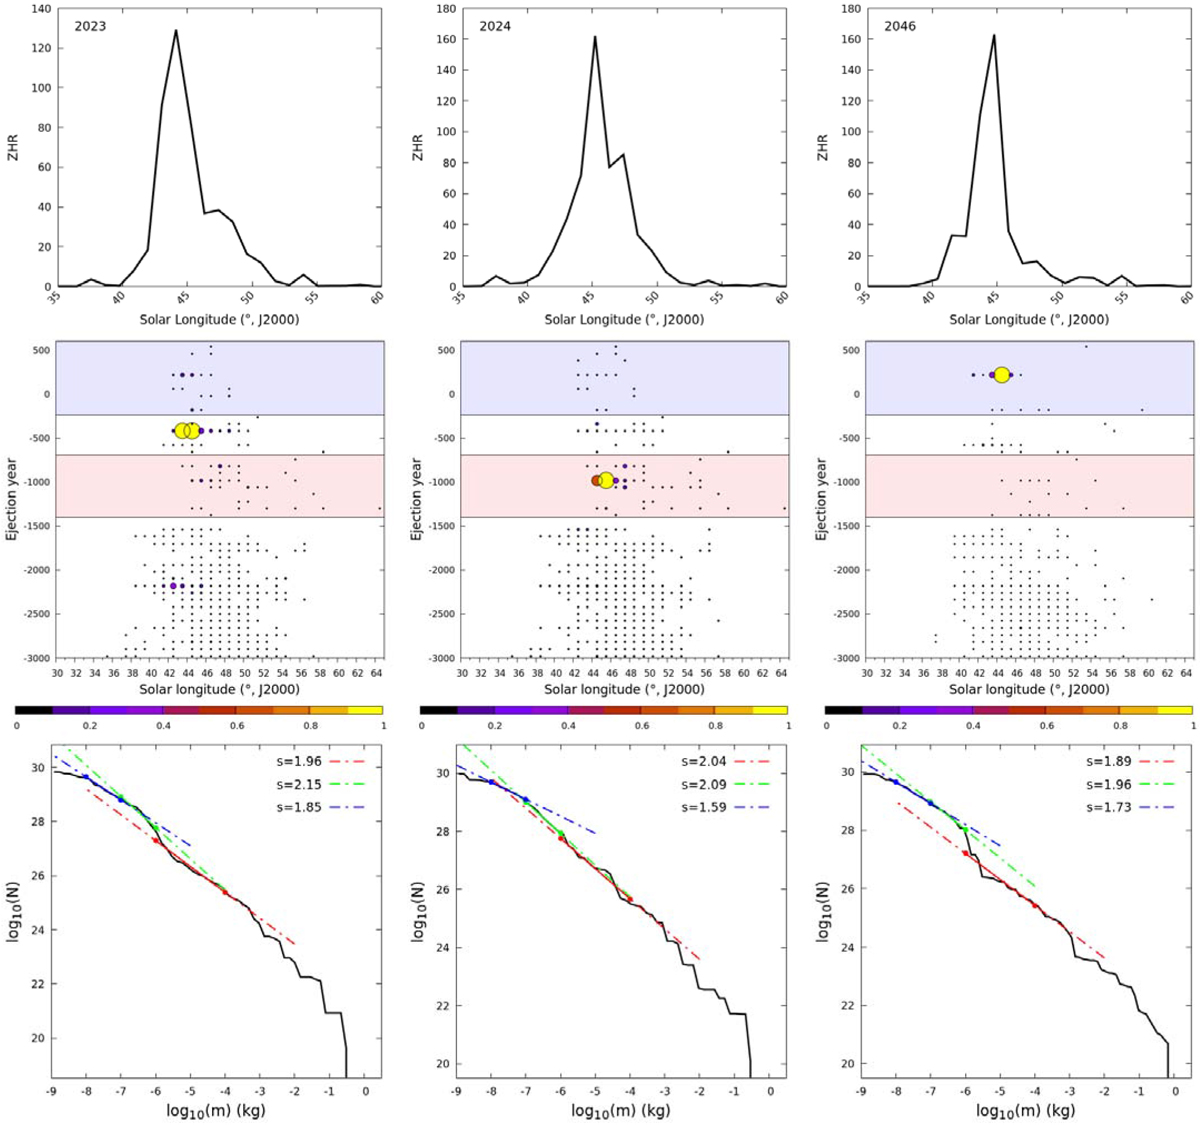
Details of model predictions for future η-Aquariid outbursts. From top to bottom: predicted model ZHR profile, relative contribution of simulated trails as a function of SL for a given year and the model cumulative mass distribution. The middle trail plots show each ejection relative contribution by circle size (small to large) and color following the scale bar, with black showing trails with the lowest contribution and yellow trails the highest contribution. The colored horizontal periods show the intervals when 1P/Halley was in the 1:6 MMR in red and in the 2:13 MMR in blue. The mass distribution plots follow the conventions from Fig. 13, with estimates of the differential mass indices s in the visual(red), video (green), and radar (blue) mass ranges provided for comparison.
Current usage metrics show cumulative count of Article Views (full-text article views including HTML views, PDF and ePub downloads, according to the available data) and Abstracts Views on Vision4Press platform.
Data correspond to usage on the plateform after 2015. The current usage metrics is available 48-96 hours after online publication and is updated daily on week days.
Initial download of the metrics may take a while.